Have you ever experienced the frustration of debugging an embedded system, only to be left scratching your head in confusion? Fear not, for today we unveil the ultimate guide to debugging embedded systems with an oscilloscope.
This powerful tool will become your trusty companion in unraveling the mysteries of your system’s behavior. Imagine the sheer satisfaction of pinpointing issues with precision, like a detective solving a complex case. With an oscilloscope in hand, you can delve deep into the inner workings of your embedded system, uncovering hidden signals and analyzing their behavior in real-time.
In this guide, we will walk you through the basics of oscilloscope operation, ensuring you have a solid foundation. You will learn how to set up your oscilloscope specifically for embedded system debugging, as well as troubleshoot common issues that may arise.
We will also explore advanced techniques for tackling complex problems and provide you with tips and best practices for efficient debugging. Get ready to elevate your debugging skills to new heights as we dive into real-world examples, demonstrating how an oscilloscope can save the day.
So, grab your oscilloscope and let’s embark on this exciting journey together!
Key Takeaways
- Oscilloscope is a powerful tool for troubleshooting and analyzing signal integrity problems in embedded systems.
- Timing analysis and waveform analysis are essential techniques for identifying abnormalities and potential problems in signals.
- Oscilloscope offers precision, detail, and mathematical functions to compare signals and detect discrepancies.
- Utilizing advanced measurement features, such as automated measurements and oscilloscope probes, can save time and improve accuracy in debugging.
Understanding the Basics of Oscilloscope Operation
Now that you’ve got your oscilloscope in hand, let’s dive into the fascinating world of understanding how this powerful tool operates. Oscilloscope troubleshooting techniques are essential for effective debugging of embedded systems.
To begin, it’s crucial to comprehend the various specifications of an oscilloscope. These specifications include the bandwidth, sample rate, and vertical resolution. The bandwidth determines the frequency range that the oscilloscope can accurately measure. The sample rate refers to the number of samples the oscilloscope can capture per second. Lastly, the vertical resolution determines the smallest voltage change that the oscilloscope can detect.
Understanding these specifications will help you choose the appropriate oscilloscope for your debugging needs. Additionally, it’ll enable you to accurately interpret the measurements and diagnose any issues in your embedded system.
Setting Up Your Oscilloscope for Embedded System Debugging
To begin debugging your embedded system with an oscilloscope, you need to connect it to your system using appropriate probes or leads. Once connected, it’s crucial to configure the oscilloscope for accurate measurements. This involves adjusting the vertical and horizontal settings, as well as the input impedance and coupling options.
Additionally, make sure to use triggering and timebase settings effectively. This will allow you to capture and analyze signals of interest, enabling you to identify potential issues or anomalies in your embedded system.
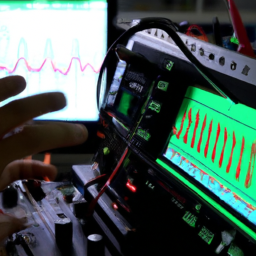
Connect the oscilloscope to your embedded system
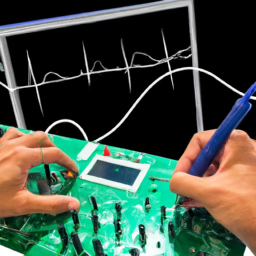
First, you’ll need to grab your trusty oscilloscope and connect it to your embedded system, unlocking the power to uncover hidden mysteries and solve complex bugs with ease!
To begin, locate the appropriate connectors on both the oscilloscope and your embedded system. These connectors may vary depending on the specific models, so consult their user manuals for guidance.
Once you have identified the connectors, connect the oscilloscope probes to the appropriate pins or ports on your embedded system. It’s crucial to ensure a secure connection to obtain accurate measurements.
After connecting the probes, power on both the oscilloscope and your embedded system.
With the oscilloscope now connected, you can begin exploring the signals and waveforms produced by your embedded system’s peripherals. This will provide valuable insights into the operation and behavior of these components, helping you diagnose and resolve any issues that may arise.
Configure the oscilloscope for accurate measurements
Ensure that you have the oscilloscope properly configured to capture precise measurements, enabling you to dive deep into the intricate details of your system’s signals and waveforms. Oscilloscope calibration is crucial for accurate measurements, so start by verifying the instrument’s calibration status and perform any necessary adjustments. Next, set the probe attenuation to match the signal amplitude, ensuring accurate representation on the screen. Additionally, select the appropriate signal acquisition technique based on your system’s characteristics. This could include single-shot acquisition for capturing rare events or repetitive acquisition for analyzing periodic signals. To engage the audience, here is a table summarizing common signal acquisition techniques:
| Technique | Description |
|---|---|
| Single-shot acquisition | Captures a single event or waveform. Useful for analyzing infrequent or transient events. |
| Repetitive acquisition | Acquires and displays repetitive signals continuously. Ideal for analyzing periodic waveforms or steady-state phenomena. |
By following these steps and utilizing the right signal acquisition techniques, you’ll be able to accurately measure and analyze your embedded system’s signals with the oscilloscope.
Use triggering and timebase settings to capture and analyze signals
Take advantage of the triggering and timebase settings on your oscilloscope to effectively capture and analyze signals, allowing you to uncover intricate details and gain a deeper understanding of your system’s behavior. Here are four key techniques to consider:
-
Triggering Techniques: Experiment with different trigger types such as edge, pulse, and video triggers to capture specific signal events. Adjust the trigger level, holdoff time, and source to accurately isolate the desired signal.
-
Timebase Settings: Adjust the time per division and horizontal position settings to control the time scale and position of the waveform display. This helps in analyzing the timing relationship between different signals.
-
Signal Analysis Techniques: Utilize cursors and measurements to quantify signal characteristics such as frequency, amplitude, rise time, and duty cycle. Use advanced features like Fast Fourier Transform (FFT) to analyze frequency components.
-
Waveform Storage and Playback: Save captured waveforms to the oscilloscope’s memory or external storage for detailed analysis. Play back the saved waveforms to analyze the signal behavior at a later time.
By mastering these triggering and timebase settings, you can efficiently capture and analyze signals, enabling you to debug your embedded system with precision and accuracy.
Troubleshooting Common Issues with an Oscilloscope
In troubleshooting common issues with an oscilloscope, you need to identify and diagnose signal integrity problems. This involves analyzing the quality of the waveform and checking for factors like noise, distortion, and reflections.
Additionally, you should analyze timing issues and signal anomalies to understand if there are any deviations from the expected behavior.
To pinpoint issues accurately, utilize advanced features like waveform math and measurements, which allow you to perform calculations and compare waveforms, enabling a more precise diagnosis of the problem at hand.
Identify and diagnose signal integrity problems
Discover the hidden glitches in your embedded system’s signal flow by diving deep into the waveform ocean with an oscilloscope. Signal integrity analysis is crucial for identifying noise sources that can disrupt the proper functioning of your system. By carefully examining the waveform, you can uncover issues such as reflections, crosstalk, and ground bounce. To help you visualize the process, imagine a 3×3 table with three columns and three rows. In the first column, you have the input signal, in the second column, you have the output signal, and in the third column, you have the ideal signal. By comparing the input and output signals to the ideal signal, you can easily spot any discrepancies and pinpoint the source of the problem. This level of precision and detail offered by an oscilloscope is invaluable in diagnosing signal integrity problems.
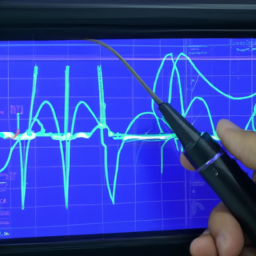
Analyze timing issues and signal anomalies
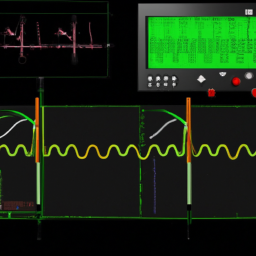
Examine the timing issues and signal anomalies in your system by utilizing an oscilloscope to understand and visualize the intricate details of your waveform.
Timing analysis is crucial in debugging embedded systems as it helps identify discrepancies between expected and actual signal timings. By carefully observing the waveforms on the oscilloscope, you can pinpoint timing issues such as jitter, skew, and delay.
Additionally, signal troubleshooting becomes easier with the oscilloscope’s ability to capture and analyze signal anomalies. Whether it’s a glitch, noise, or unexpected signal behavior, the oscilloscope allows you to zoom in and analyze the details to determine the root cause.
With its high sampling rate and precise triggering capabilities, the oscilloscope provides a powerful tool for debugging timing issues and resolving signal anomalies in embedded systems.
Use advanced features like waveform math and measurements to pinpoint issues
Unleash the power of waveform math and measurements to precisely identify and tackle issues with timing and signal anomalies in your system. Here are four ways you can utilize advanced features like waveform math and measurements to pinpoint issues in your embedded system:
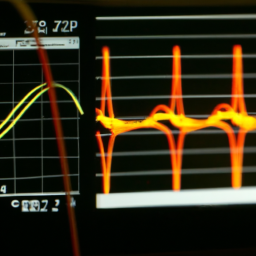
-
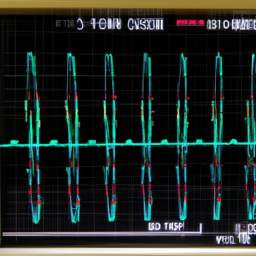
Perform waveform analysis: By examining the shape, amplitude, and frequency of waveforms, you can identify abnormalities and potential problems.
-
Use signal characterization: Measure key parameters such as rise time, fall time, and pulse width to gain a deeper understanding of the signal behavior and identify any deviations from the expected values.
-
Apply mathematical functions: Utilize waveform math to perform operations like addition, subtraction, multiplication, and division on multiple waveforms. This helps in comparing signals and detecting any discrepancies.
-
Utilize automated measurements: Take advantage of the oscilloscope’s built-in measurement capabilities to automatically quantify important signal characteristics such as frequency, period, duty cycle, and more. This saves time and improves accuracy in the debugging process.
By employing these advanced features, you can effectively diagnose and resolve issues related to timing and signal anomalies in your embedded system.
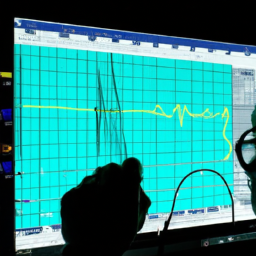
Advanced Oscilloscope Techniques for Complex Debugging
Master the art of using an oscilloscope to unravel intricate issues in embedded systems with advanced techniques for complex debugging. When it comes to waveform analysis, advanced oscilloscope techniques can be invaluable.
With the ability to perform precise measurements, oscilloscope probes are essential tools for accurate analysis. By utilizing advanced features like waveform math and measurements, you can pinpoint issues with precision and efficiency. These techniques allow you to delve deeper into the complex world of embedded systems and identify the root cause of problems.
Whether it’s analyzing complex waveforms or measuring voltage levels, the oscilloscope provides the necessary tools to tackle intricate debugging challenges. With a thorough understanding of advanced oscilloscope techniques, you can confidently troubleshoot and resolve even the most complex issues in embedded systems.
Tips and Best Practices for Efficient Debugging
Improve your debugging efficiency by implementing these helpful tips and best practices. Here are three techniques that will optimize your signal analysis and make debugging embedded systems with an oscilloscope more efficient:
-
Use trigger settings: Set up your oscilloscope to trigger on specific events or conditions that are relevant to your debugging process. This allows you to capture and analyze the signal of interest more effectively.
-
Adjust timebase and voltage scales: By adjusting the timebase and voltage scales, you can focus on the specific part of the waveform that requires analysis. This reduces the time spent on irrelevant signal details and allows for a more efficient debugging process.
-
Utilize advanced measurement features: Take advantage of the advanced measurement features of your oscilloscope, such as cursors, automated measurements, and math functions. These tools provide valuable insights into the signal behavior and can help identify and resolve issues quickly.
By following these efficient debugging techniques and optimizing your signal analysis, you’ll be able to debug embedded systems with an oscilloscope more effectively.
Troubleshooting Real-World Examples with an Oscilloscope
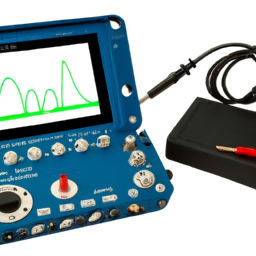
Discover how troubleshooting real-world examples becomes easier when you utilize the powerful capabilities of an oscilloscope.
When dealing with embedded systems, power supply issues can often cause problems. By connecting an oscilloscope to the power supply circuit, you can easily identify any voltage fluctuations, ripple, or noise that may be affecting the system’s performance.
The oscilloscope’s high-resolution display allows you to analyze the waveform and pinpoint any abnormalities.
Additionally, when troubleshooting embedded systems, it’s crucial to analyze noise and interference. With the oscilloscope’s ability to capture and display signals in real-time, you can identify unwanted noise and interference sources.
By examining the waveform, you can determine the frequency, amplitude, and timing of the noise, helping you to pinpoint the source and take the necessary steps to mitigate it.
Frequently Asked Questions
Can I use any oscilloscope for debugging embedded systems, or are there specific features I should look for?
When it comes to debugging embedded systems, not any old oscilloscope will do. Compatibility is key. Look for an oscilloscope that is specifically designed for working with embedded systems. It must have features like digital signal analysis, protocol decoding, and advanced triggering options.
These tools will help you quickly identify and solve issues with your embedded system. Don’t settle for a generic oscilloscope; invest in one tailored to your needs.
How can I determine the appropriate voltage range and time scales to use on my oscilloscope when debugging an embedded system?
To determine the appropriate voltage range on your oscilloscope, you need to consider the signal levels of your embedded system. Start by identifying the maximum and minimum voltage values in your system. Set the voltage range on the oscilloscope to encompass these values, ensuring that the signal is not clipped or distorted.
When selecting time scales, consider the frequency of the signal. Choose a time scale that allows you to clearly observe the waveform without losing important details.
Are there any specific precautions I should take when connecting my oscilloscope probes to the circuitry of an embedded system?
When connecting your oscilloscope probes to the circuitry of an embedded system, there are some specific precautions you should take.
First, ensure proper grounding to avoid any grounding issues that could lead to inaccurate measurements or damage to the system.
Second, when probing high frequency signals, use appropriate probe techniques to minimize loading effects and maintain signal integrity.
These precautions are crucial in obtaining accurate and reliable measurements during your debugging process.
What are some common pitfalls to avoid when using an oscilloscope for debugging embedded systems?
Some common mistakes to avoid when using an oscilloscope for debugging embedded systems include improper grounding, incorrect probe settings, and overlooking signal integrity issues.
To troubleshoot effectively, ensure proper grounding by connecting the oscilloscope’s ground lead correctly. Set the probe’s attenuation and voltage range appropriately to avoid distorted measurements.
Additionally, pay attention to signal integrity, checking for noise, reflections, or cross-talk that could affect your measurements.
Are there any alternative tools or techniques that can be used in conjunction with an oscilloscope to enhance the debugging process for embedded systems?
To enhance the debugging process for embedded systems, there are a range of alternative tools and techniques that can be used in conjunction with an oscilloscope.
Some options include logic analyzers, which can capture and analyze digital signals, as well as protocol analyzers, which help in decoding and analyzing communication protocols.
Additionally, software debuggers and simulators can be used to test and debug code without the need for physical hardware.
These tools and techniques provide valuable insights and complement the capabilities of an oscilloscope, enabling a more comprehensive debugging approach.
Conclusion
In conclusion, the oscilloscope is the knight in shining armor for debugging embedded systems. Armed with its powerful capabilities, it unravels the mysteries lurking within the system’s intricate circuitry.
Just like a skilled knight, it fearlessly battles against common issues, employing advanced techniques to conquer complex debugging challenges. With the oscilloscope as your loyal companion, armed with tips and best practices, you can efficiently troubleshoot real-world examples.
So, embrace this mighty tool and embark on your debugging quest, for victory awaits!