Did you know that over 90% of embedded systems rely on serial communication for data transfer? With such a high reliance on this method, it’s crucial to have the necessary tools to debug and troubleshoot any communication issues that may arise. That’s where an oscilloscope comes in.
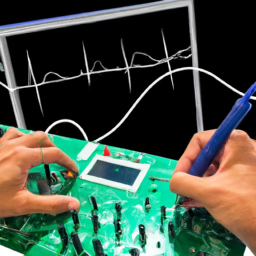
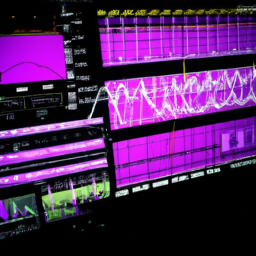
An oscilloscope is a powerful tool that allows you to visualize and analyze electrical signals, making it an invaluable asset for debugging serial communications in embedded systems. By connecting the oscilloscope to your system, you can capture and analyze the serial data being transmitted, helping you identify and resolve any issues.
In this article, we will guide you through the process of using an oscilloscope to debug serial communications in embedded systems. From understanding the basics of serial communication to setting up your oscilloscope and capturing data, we will provide you with step-by-step instructions and best practices.
So, whether you’re a seasoned embedded systems developer or just starting out, get ready to enhance your debugging skills and ensure smooth and efficient serial communications in your projects.
Key Takeaways
- Serial communication protocols like UART, SPI, and I2C are essential for communication in embedded systems.
- An oscilloscope can be used to troubleshoot serial communication issues by capturing and analyzing electrical signals.
- Properly connecting the oscilloscope to the embedded system and adjusting its settings is crucial for effective debugging.
- Analyzing the waveform using the oscilloscope’s display can help identify voltage levels, timing, noise, and anomalies in the signal.
Understanding Serial Communications in Embedded Systems
Imagine diving deep into the intricate web of serial communications in embedded systems, unraveling the complexities and gaining a thorough understanding of how it all works.
Serial communication protocols, such as UART (Universal Asynchronous Receiver/Transmitter), SPI (Serial Peripheral Interface), and I2C (Inter-Integrated Circuit), are the backbone of communication between various components in an embedded system. They allow data to be transmitted in a sequential manner, bit by bit, enabling devices to communicate with each other.
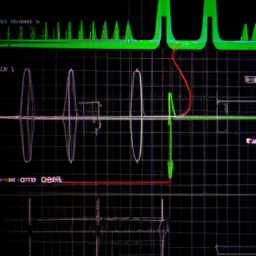
However, troubleshooting serial communication issues can be a daunting task. This is where an oscilloscope comes in handy. By connecting the oscilloscope to the serial communication lines, you can capture and analyze the electrical signals, ensuring that the data is being transmitted correctly. With the oscilloscope’s ability to display waveforms and measure timing parameters, you can quickly identify and resolve any communication issues, making debugging serial communications in embedded systems a breeze.
Setting Up Your Oscilloscope
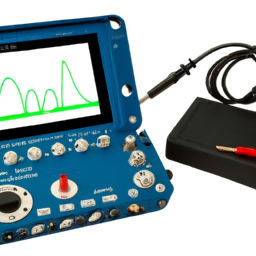
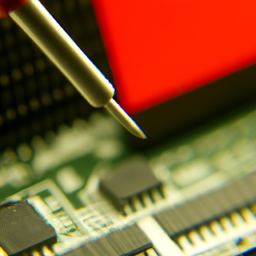
To connect your oscilloscope to your embedded system, start by identifying the appropriate serial communication port on your embedded system. Use a suitable cable or adapter to connect the oscilloscope probe to the TX and RX pins of the serial port.
Ensure that the ground connection is properly made to establish a reliable connection.
Next, adjust the oscilloscope settings for serial communication by selecting the appropriate trigger mode, timebase, and voltage scales. Set the trigger level to detect the serial data and adjust the timebase to capture the entire communication sequence.
Lastly, adjust the voltage scales to ensure that the serial data is displayed clearly and accurately on the oscilloscope screen.
Connecting the Oscilloscope to Your Embedded System
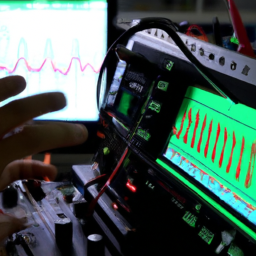
Furthermore, by properly connecting the oscilloscope to your embedded system, you can effectively debug serial communications. To ensure a successful connection, follow these steps:
- Connect the oscilloscope probe to the embedded system’s serial communication pins. This allows you to capture the data being transmitted.
- Use the oscilloscope’s ground lead to connect to the system’s ground pin.
- Connect the oscilloscope’s channel input to the system’s transmit (TX) or receive (RX) pin, depending on what you want to monitor.
- Set up the oscilloscope to interpret the serial data correctly.
- Configure the oscilloscope’s trigger settings to trigger on the start bit of the serial data.
- Adjust the oscilloscope’s timebase and voltage scales to ensure the signals are displayed clearly.
By following these steps, you can effectively use the oscilloscope to troubleshoot and interpret serial data in your embedded system.
Adjusting the Oscilloscope Settings for Serial Communication
When adjusting the oscilloscope settings for serial communication, it’s important to ensure that the signals are displayed clearly and that the trigger settings are configured to capture the start bit of the data.
To troubleshoot serial communication, you need to interpret the oscilloscope waveforms accurately. Firstly, set the oscilloscope to the appropriate voltage range to match the signal levels of your serial communication.
Adjust the time base to capture multiple data bits and their transitions. Use the trigger settings to capture the start bit of the data frame for accurate analysis. Ensure that the oscilloscope is set to trigger on the falling or rising edge of the start bit.
Adjust the trigger level to capture the start bit consistently. By carefully adjusting the oscilloscope settings, you can effectively analyze and debug serial communication issues in your embedded system.
Capturing and Analyzing Serial Data
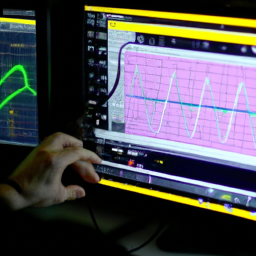
First things first, grab your trusty oscilloscope and start capturing and analyzing serial data to uncover those hidden communication bugs. Remember, ‘measure twice, debug once!’
Here are three key steps to successfully analyze serial data using an oscilloscope:
-
Set the trigger: Configure the oscilloscope to trigger on the serial data signal, ensuring that the waveform is stable and consistent for accurate analysis.
-
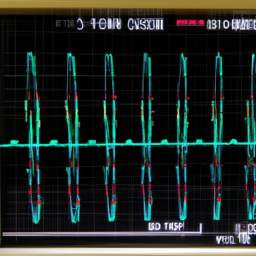
Capture the data: Use the oscilloscope’s acquisition mode to capture a sufficient amount of serial data. This allows you to examine the entire communication sequence and identify any anomalies or errors.
-
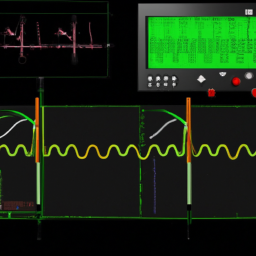
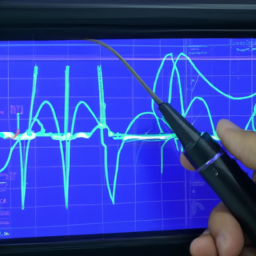
Interpret the waveforms: Analyze the captured waveforms to understand the communication patterns, such as baud rate, data bits, stop bits, and parity. Look for any glitches, noise, or timing issues that may be causing communication errors.
By following these steps and leveraging the power of an oscilloscope, you can effectively analyze serial data and pinpoint the root cause of communication issues in your embedded system.
Debugging Techniques with an Oscilloscope
Master the art of troubleshooting with an oscilloscope and uncover the hidden secrets of your electronic creations.
When it comes to advanced troubleshooting in embedded systems, an oscilloscope is an invaluable tool. By correctly interpreting oscilloscope measurements, you can quickly identify and debug issues in your serial communications.
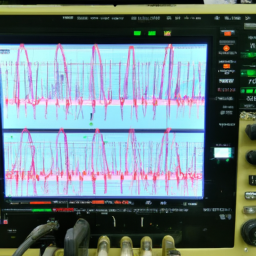
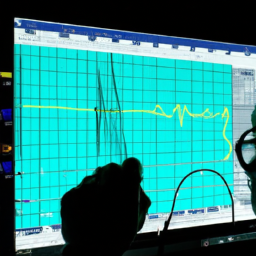
Start by setting up your oscilloscope to capture the serial data and ensure proper triggering. Use the oscilloscope’s waveform display to analyze the signal’s voltage levels, timing, and noise. Pay close attention to the data transitions and ensure they meet the expected specifications.
Additionally, use the oscilloscope’s triggering capabilities to capture specific events or sequences of data. By mastering these debugging techniques with an oscilloscope, you can effectively diagnose and resolve even the most complex serial communication issues in your embedded systems.
Tips and Best Practices for Effective Serial Communication Debugging
To enhance your troubleshooting skills, it’s crucial to embrace effective tips and best practices for successful debugging of serial communication issues in embedded systems.
When dealing with serial communication troubleshooting, utilizing an oscilloscope can greatly aid in the process. To effectively interpret oscilloscope waveforms, start by setting the correct voltage and time scales to capture the signal accurately. Ensure that the oscilloscope probe is properly connected to the communication lines, and use a ground reference for accurate measurements. Pay attention to the signal’s voltage level, timing, and noise characteristics.
Analyze the waveform for any anomalies such as glitches, ringing, or crosstalk. Additionally, use the oscilloscope’s triggering capabilities to capture specific events or patterns.
By following these tips and best practices, you can effectively utilize an oscilloscope to debug serial communications in embedded systems.
Frequently Asked Questions
Can I use an oscilloscope to debug other types of communication protocols besides serial communications?
Yes, you can use an oscilloscope to debug other types of communication protocols besides serial communications. When it comes to debugging I2C protocols, an oscilloscope can help you analyze the waveform and identify any issues such as incorrect timing or noise.
Similarly, for troubleshooting SPI communications, an oscilloscope allows you to visualize the signal, check for timing issues, and validate the integrity of the data being transferred. Its precise measurements and detailed analysis capabilities make it an invaluable tool for debugging various communication protocols.
Are there any specific oscilloscope settings or features that are important for capturing accurate serial data?
To capture accurate serial data, there are specific oscilloscope settings and features you should consider. First, set the oscilloscope’s trigger to the appropriate baud rate and data format. This ensures the oscilloscope synchronizes with the serial data.
Use a high enough sampling rate to accurately capture the signal’s waveform. Enable serial decoding and triggering, allowing the oscilloscope to interpret and display the serial data in a more readable format.
Finally, adjust the voltage scale and timebase to ensure clear and accurate measurements.
How can I determine if there are any hardware issues affecting my serial communication?
To troubleshoot software issues affecting serial communication in embedded systems, start by checking the code for any bugs or errors. Ensure that the correct baud rate, parity, and stop bits are set. Test different software configurations and monitor for any anomalies using a serial monitor tool.
Common causes of hardware issues impacting serial communication include faulty wiring, incorrect voltage levels, and inadequate grounding. Verify the physical connections, check for signal integrity, and use an oscilloscope to analyze the waveform for any abnormalities.
Can I use an oscilloscope to debug wireless serial communications?
Yes, an oscilloscope can be used to debug wireless serial communications. When troubleshooting Wi-Fi serial communications, you can utilize an oscilloscope to analyze the signal quality, amplitude, and timing of the transmitted data.
Additionally, by using an oscilloscope, you can identify any noise or interference that may be affecting the wireless communication. Similarly, when debugging Bluetooth serial communications, an oscilloscope can help you analyze the signal integrity and identify any issues that may be causing communication problems.
Are there any limitations or challenges when using an oscilloscope to debug serial communications in embedded systems?
When it comes to using an oscilloscope to debug serial communications in embedded systems, you’ll encounter some limitations and challenges. The oscilloscope provides valuable insights, but it can’t magically solve all your problems.
You may face difficulties in capturing and analyzing data due to the complex nature of serial communications. Additionally, debugging embedded systems requires a deep understanding of protocols and signal waveforms. So, be prepared to tackle these obstacles while using an oscilloscope for debugging serial communications in embedded systems.
Conclusion
Congratulations! You’ve successfully explored the intricacies of using an oscilloscope to debug serial communications in embedded systems. By mastering the art of setting up your oscilloscope, capturing and analyzing serial data, and applying effective debugging techniques, you’ve equipped yourself with invaluable skills.
Remember to adhere to the tips and best practices outlined to ensure seamless serial communication debugging. With this newfound expertise, you’re now well-prepared to tackle any challenges that may arise in your embedded systems journey.
Happy debugging!