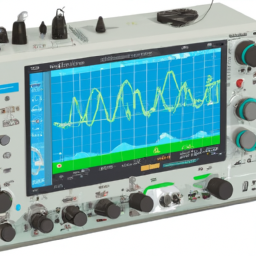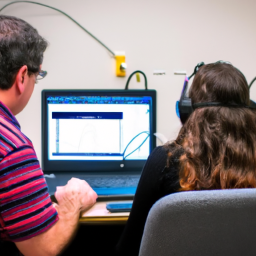
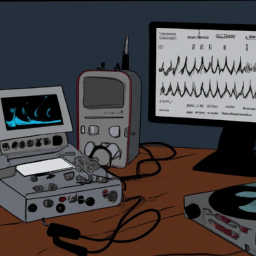
So, you think you’ve got what it takes to analyze signals, huh? Well, lucky for you, we’ve got just the tool to help you unravel the mysteries of those complex waveforms. Introducing the PC-based oscilloscope, your gateway to signal analysis mastery.
In this article, we will guide you through the ins and outs of using a PC-based oscilloscope for signal analysis. You’ll learn how to set up your oscilloscope, navigate the software like a pro, capture and analyze signals with precision, and even delve into advanced techniques.
But wait, there’s more! We’ll also equip you with troubleshooting skills to tackle any signal-related problems that come your way. From voltage measurements to frequency analysis, this comprehensive guide will transform you into a signal analysis wizard.
So, grab your thinking cap and get ready to dive into the fascinating world of signal analysis with your trusty PC-based oscilloscope. Let’s get started!
Key Takeaways
- PC-based oscilloscopes are a convenient and versatile tool for signal analysis.
- Proper setup and understanding of the basics of signal analysis are crucial for accurate measurements.
- Frequency analysis plays a significant role in signal analysis and can provide valuable insights.
- The user interface of a PC-based oscilloscope offers customization options for a personalized experience.
Understanding the Basics of Signal Analysis
Understanding the basics of signal analysis is essential for effectively utilizing a PC-based oscilloscope. With digital signal processing becoming increasingly prevalent, it’s crucial to comprehend the concepts of frequency analysis and how it relates to signal analysis.
In signal analysis, digital processing techniques are used to manipulate and analyze signals, allowing for the extraction of useful information. Frequency analysis plays a vital role in signal analysis as it involves determining the various frequencies present in a signal and their respective amplitudes. This information can provide insights into the characteristics and behavior of the signal under examination.
Once you have a firm grasp on the fundamentals of signal analysis, you can move on to setting up your PC-based oscilloscope and begin exploring the numerous possibilities it provides.
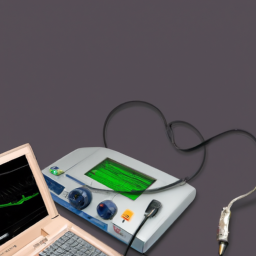
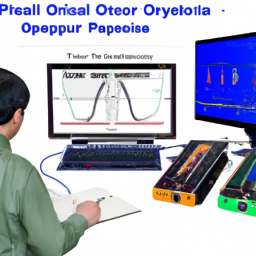
Setting Up Your PC-Based Oscilloscope
To begin setting up your oscilloscope on a computer, first, familiarize yourself with the system requirements and ensure that your computer meets them. The PC requirements for using a PC-based oscilloscope typically include a minimum processor speed, RAM, and operating system version. Refer to the manufacturer’s documentation for specific details. Once you have confirmed that your computer meets the requirements, connect the oscilloscope to your computer using a USB cable or any other interface specified by the manufacturer. Some oscilloscopes may also require additional power connections. After the physical connection is established, install the oscilloscope software provided by the manufacturer. This software allows you to control and analyze signals using your PC-based oscilloscope. With the software installed, you can now navigate the oscilloscope interface and begin analyzing signals.
Continue to the next section to learn how to navigate the oscilloscope software and perform signal analysis.
Navigating the Oscilloscope Software
To navigate the oscilloscope software, you should first familiarize yourself with the user interface. This will allow you to easily locate and access the various features and settings.
Adjusting waveform settings is crucial to ensure accurate signal analysis. It allows you to modify the display and measurement parameters according to your needs.
Using triggering and measurement tools is essential for capturing and analyzing specific parts of the waveform. It also helps in obtaining precise measurements of different signal characteristics.
Remember to leave a double new line after each complete concept.
Familiarizing yourself with the user interface
Get ready to explore the user interface and all its features on your PC-based oscilloscope. The user interface is highly customizable, allowing you to tailor it to your preferences. You can adjust the layout, colors, and display options to create a workspace that suits your needs.
Optimizing the signal display is crucial for accurate analysis, and the user interface provides various tools to help you achieve this. You can adjust the timebase, voltage scale, and trigger settings to ensure the waveform is clearly visible and easy to interpret.
Additionally, the user interface offers advanced features such as measurement tools, cursors, and math functions to further enhance your signal analysis capabilities.
Now, let’s dive into adjusting waveform settings for even more precise analysis.
Adjusting waveform settings
Dive into the world of waveform settings and witness the incredible precision it brings to your analysis. With a PC-based oscilloscope, you have complete control over the waveform display and signal measurement.
Adjusting the waveform settings allows you to fine-tune the visualization of the signal, ensuring accurate analysis. You can modify parameters such as timebase, voltage scale, and triggering options to capture the desired portion of the waveform with optimal resolution.
This level of customization enables you to zoom in on specific details or zoom out to get a broader view of the signal. By adjusting waveform settings, you can enhance the visibility of subtle variations and anomalies, making it easier to identify patterns, measure parameters, and perform detailed analysis.
Now, let’s move on to using triggering and measurement tools for even more comprehensive analysis.
Using triggering and measurement tools
Now that you’ve adjusted the waveform settings on your PC-based oscilloscope, it’s time to delve into the world of triggering and measurement tools.
These tools are essential for accurate signal analysis. By using triggering techniques, you can capture specific events or patterns in your waveform, allowing for precise measurements. The triggering options on a PC-based oscilloscope include edge triggering, pulse width triggering, and video triggering, among others.
Additionally, measurement tools such as cursors, automatic measurements, and statistics provide valuable information about your signals, ensuring measurement accuracy. Understanding how to use these features effectively will greatly enhance your signal analysis capabilities.
So, let’s move on to the next section where we’ll explore the process of capturing and analyzing signals in more detail.
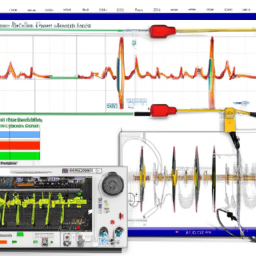
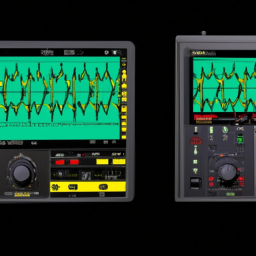
Capturing and Analyzing Signals
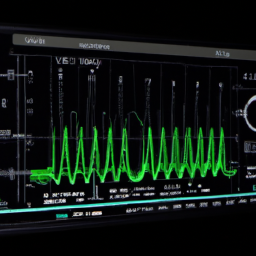
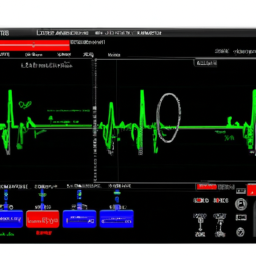
To start capturing and analyzing signals with a PC-based oscilloscope, simply connect the device to your computer and watch as waveforms appear on the screen. This allows you to perform signal processing and frequency analysis with ease.
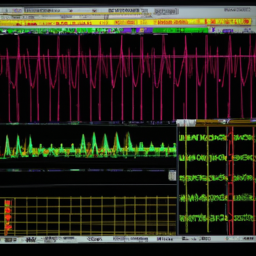
The oscilloscope’s software interface provides various measurement tools, such as cursors and markers, that allow you to accurately measure signal characteristics like frequency, amplitude, and rise time. Additionally, you can save and export the captured waveforms for further analysis or documentation.
With the ability to zoom in and out, you can closely examine specific portions of the signal for detailed analysis. By using these features, you can gain valuable insights into the behavior of your signals.
Moving on to advanced techniques for signal analysis, you can delve deeper into specific aspects of waveform analysis, such as signal integrity, noise analysis, and modulating signals.
Advanced Techniques for Signal Analysis
Uncover the depths of waveform wisdom with advanced techniques for signal scrutiny. Explore signal integrity, noise analysis, and modulating mastery.
These advanced techniques take your signal analysis to a whole new level. They allow you to delve deeper into the intricacies of your signals. Signal processing plays a crucial role in these techniques, enabling you to manipulate and analyze signals in ways that weren’t possible before.
By employing advanced algorithms and mathematical transformations, you can extract valuable information from your signals. Uncover hidden patterns and identify anomalies. Whether it’s analyzing the effects of noise on your signals or understanding the impact of different modulation schemes, these advanced techniques empower you to gain a comprehensive understanding of your signals.
Transitioning into troubleshooting and problem-solving with signal analysis, you can apply these techniques to diagnose and resolve issues in your signal processing workflow.
Troubleshooting and Problem-Solving with Signal Analysis
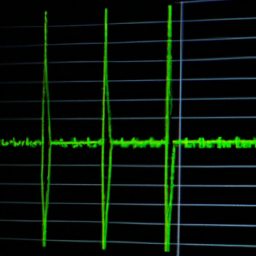
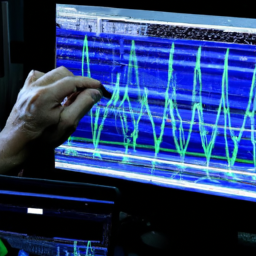
Delving into the intricacies of waveform analysis allows you to navigate through troubleshooting and problem-solving scenarios with ease. When encountering common signal issues, such as noise, distortion, or irregularities, interpreting waveform data becomes crucial.
By analyzing the shape, amplitude, frequency, and timing of the signals, you can identify the root cause of the problem and devise appropriate solutions. For instance, if you notice unexpected spikes or dips in the waveform, it could indicate a faulty component or improper grounding.
On the other hand, if the waveform appears distorted or exhibits noise, it might suggest interference from external sources. By carefully examining the waveform and comparing it to reference signals, you can pinpoint the issue and take corrective actions to resolve the problem effectively.
Frequently Asked Questions
Can a PC-based oscilloscope be used with any type of computer operating system?
A PC-based oscilloscope can be used with various operating systems, including Windows, macOS, and Linux. While compatibility may vary depending on the specific model and software, most manufacturers provide support for multiple platforms.
Using a PC-based oscilloscope offers several advantages over traditional hardware oscilloscopes, such as cost-effectiveness, portability, and the ability to easily save and analyze data. However, there are some limitations, such as the need for a stable computer system and potential latency issues.
Software and tools available for advanced signal analysis include waveform analysis, spectrum analysis, and protocol decoding.
How can I connect my PC-based oscilloscope to an external device or circuit?
To connect external devices or circuits to your PC-based oscilloscope, start by identifying the appropriate input and output ports on both your oscilloscope and the external device. Use the appropriate cables or adapters to establish a physical connection between them. Make sure the connection is secure and properly inserted. If you encounter any issues, troubleshoot by checking the cables, ports, and device settings.
Is it possible to capture and analyze signals in real-time using a PC-based oscilloscope?
Yes, it’s possible to capture and analyze signals in real-time using a PC-based oscilloscope. By connecting the oscilloscope to the external device or circuit, you can view and measure the signals in real-time. This allows for immediate analysis and troubleshooting.
The benefits of using a PC-based oscilloscope for real-time signal analysis include the ability to easily save and share data, access advanced analysis tools, and integrate with other software for comprehensive signal processing and visualization.
Are there any limitations or drawbacks to using a PC-based oscilloscope compared to a traditional hardware oscilloscope?
Using a PC-based oscilloscope has its limitations and drawbacks when compared to a traditional hardware oscilloscope. Like a bird with clipped wings, it may lack the same level of precision and accuracy.
PC-based oscilloscopes are susceptible to noise interference and have lower bandwidth capabilities. Additionally, they may experience latency issues and require a stable computer system.
However, despite these drawbacks, they offer convenience, portability, and cost-effectiveness, making them a viable option for many signal analysis applications.
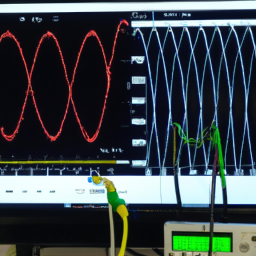
Can I use a PC-based oscilloscope for advanced signal analysis techniques such as FFT or frequency domain analysis?
Yes, you can definitely use a PC-based oscilloscope for advanced signal analysis techniques such as FFT or frequency domain analysis. One of the advantages of using a PC-based oscilloscope is its ability to perform complex mathematical operations, like Fourier analysis, on the captured signals. By utilizing software and powerful processing capabilities, a PC-based oscilloscope allows for more advanced signal analysis techniques compared to traditional hardware oscilloscopes.
Conclusion
Congratulations! You’ve successfully journeyed into the realm of signal analysis with your PC-based oscilloscope. As you’ve navigated through the software, capturing and analyzing signals, you’ve unlocked a world of possibilities. Like a skilled explorer, you’ve honed your troubleshooting skills and problem-solving abilities, uncovering hidden secrets within the signals.
Remember, this tool isn’t just for the experts; it’s a gateway to understanding and harnessing the power of signals. So, continue your quest, and may the waves of knowledge guide you to new horizons.