Do you find yourself facing memory issues in your embedded systems?
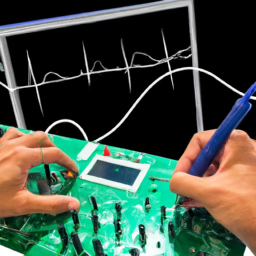
Imagine this scenario: You have developed an embedded system with an advanced functionality that requires efficient memory utilization. However, during testing, you encounter frequent crashes and erratic behavior that can be traced back to memory issues.
How can you effectively debug and resolve these problems?
In this article, we will explore how you can leverage the power of an oscilloscope to debug memory issues in embedded systems. By understanding the basics of memory issues and familiarizing yourself with the functionality of an oscilloscope, you can use its measurements to identify memory issues and analyze memory access patterns. Additionally, we will delve into utilizing triggering and advanced features of an oscilloscope to further enhance your debugging process.
With the knowledge gained from this article, you will be equipped to troubleshoot and resolve memory issues in your embedded systems effectively, ensuring optimal performance and reliability.
So let’s dive in and discover the valuable insights an oscilloscope can provide in debugging memory issues.
Key Takeaways
- Memory issues in embedded systems can lead to crashes and erratic behavior
- Oscilloscope troubleshooting techniques include observing memory bus signals and analyzing timing
- Oscilloscope measurements can be used to identify memory issues
- Troubleshooting techniques and memory optimization strategies can effectively resolve memory issues in embedded systems.
Understand the Basics of Memory Issues in Embedded Systems
Understanding the basics of memory issues in embedded systems is like peering into a labyrinth of electronic pathways, where each twist and turn can lead to unforeseen bugs and glitches.
Memory allocation plays a crucial role in these systems, as it determines how the limited memory resources are divided among different tasks and functions. Improper memory allocation can result in memory leaks, where memory is allocated but not properly released, leading to a gradual depletion of available memory. This can cause system crashes, data corruption, or even complete system failure.
Identifying and debugging memory issues requires a thorough understanding of the system’s memory architecture, as well as specialized tools like an oscilloscope. By monitoring memory usage and analyzing memory access patterns, an oscilloscope can help pinpoint the root cause of memory issues and facilitate effective debugging in embedded systems.
Familiarize Yourself with the Functionality of an Oscilloscope
Get to know the ins and outs of an oscilloscope by exploring its features and capabilities. An oscilloscope is a vital tool for troubleshooting memory issues in embedded systems. To effectively debug memory issues, it’s important to understand the functionality of an oscilloscope. Here are three key aspects to consider:
-
Oscilloscope troubleshooting techniques:
- Use the oscilloscope to observe the memory bus signals and identify any anomalies or glitches.
- Analyze the timing of read and write operations to detect any issues with memory access.
- Use triggering options to capture specific events or patterns for further analysis.
-
Importance of oscilloscope calibration in memory issue debugging:
- Ensure the oscilloscope is properly calibrated to accurately measure and interpret the signals.
- Calibrate the oscilloscope regularly to maintain its accuracy and reliability.
- Incorrect calibration can lead to incorrect measurements and misinterpretation of memory signals.
By familiarizing yourself with these aspects, you can effectively utilize an oscilloscope for debugging memory issues in embedded systems.
Use Oscilloscope Measurements to Identify Memory Issues
To identify memory issues in your embedded system, you can use an oscilloscope to perform signal integrity analysis, timing analysis, and voltage and current measurements.
By analyzing the integrity of signals, you can identify any noise or distortion that may be affecting the memory.
Timing analysis helps you determine if there are any delays or inconsistencies that could be causing memory issues.
Additionally, voltage and current measurements can provide insights into the power supply stability and any potential fluctuations that may impact the memory’s performance.
Signal integrity analysis
Examine the oscilloscope readings closely to pinpoint any potential signal integrity issues, ensuring optimal performance of your embedded system and avoiding frustrating memory problems.
Signal integrity troubleshooting is crucial in identifying noise sources that can affect the performance of your system.
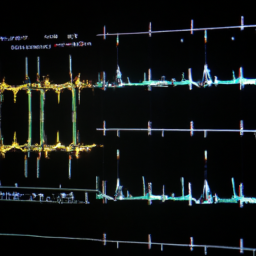
Start by analyzing the voltage levels and waveforms on the oscilloscope to check for any abnormalities or distortions. Look for any unexpected noise or jitter that could indicate signal integrity issues.
Pay attention to the rise and fall times of the signals, as well as the presence of any overshoot or undershoot.
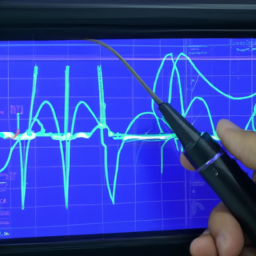
Use the oscilloscope’s triggering capabilities to capture specific events or signal patterns that may be causing memory issues.
By carefully analyzing the oscilloscope measurements, you can effectively identify and resolve signal integrity issues in your embedded system.
Timing analysis
Timing analysis allows you to precisely evaluate the synchronization and coordination of events in your system, ensuring smooth and efficient operation. By analyzing the timing of signals and events, you can identify any delays or timing issues that may be affecting the performance of your memory.
This analysis involves measuring the time it takes for signals to propagate through your system and assessing the timing relationship between different events. By doing so, you can identify any timing violations or bottlenecks that may be causing memory performance issues.
Additionally, timing analysis can help you optimize the timing parameters of your system, such as clock frequencies and signal delays, to improve memory performance. It plays a crucial role in debugging memory issues in embedded systems and ensuring optimal memory performance.
Voltage and current measurements
By accurately measuring voltage and current, one can gain valuable insights into the performance and efficiency of the system, contributing to a deeper understanding of its intricacies.
Voltage monitoring allows you to track the voltage levels at various points in the system, helping you identify abnormal fluctuations or drops that may indicate a problem.
Current analysis, on the other hand, provides information about the power consumption and load on the system, enabling you to pinpoint potential issues such as excessive current draw or inefficient power usage.
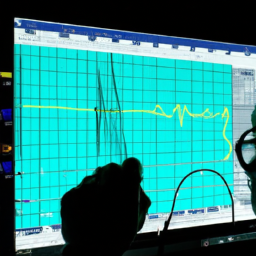
By utilizing an oscilloscope for these measurements, you can visualize and analyze the waveforms in real-time, allowing for precise and detailed observations.
This data can then be used to detect and debug memory issues, ensuring optimal performance and reliability of the embedded system.
Analyze Memory Access Patterns
To analyze memory access patterns, you need to monitor both read and write operations. By doing so, you can identify any abnormal patterns that may indicate memory issues.
Pay attention to the frequency and timing of these operations, as well as any unexpected delays or errors that occur during the process.
Monitoring read and write operations
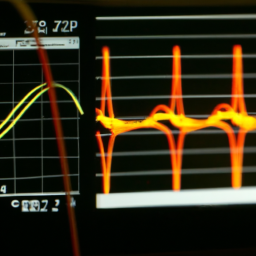
One way to effectively monitor read and write operations in embedded systems is with the use of an oscilloscope. The oscilloscope can provide valuable insights into memory issues. By monitoring power consumption, you can identify patterns that indicate memory access or usage problems.
The oscilloscope can capture voltage fluctuations and correlate them to specific read or write operations. This allows you to analyze memory usage in real-time. Additionally, the oscilloscope can help you identify any abnormal behavior, such as unexpected spikes or drops in voltage. These abnormalities might indicate memory corruption or other issues.
By closely monitoring read and write operations using an oscilloscope, you can gain a deeper understanding of the memory behavior in your embedded system. This can help you efficiently debug any memory-related issues.
Identifying patterns that may indicate memory issues
Discover the hidden clues within power consumption patterns that could reveal potential memory problems in your system. Detecting abnormal behavior in power consumption can be a valuable tool for identifying memory issues in embedded systems.
By closely monitoring power fluctuations during read and write operations, you can detect patterns that may indicate memory problems. Look for sudden spikes or drops in power consumption, as well as irregularities in the timing and duration of operations.
Analyzing memory allocation can also provide insights into potential issues. Keep an eye out for excessive memory usage, frequent memory leaks, or inefficient memory allocation. These abnormal patterns can point towards memory problems such as buffer overflows, memory leaks, or improper memory management.
By identifying these patterns, you can effectively debug and resolve memory issues in your embedded system.
Utilize Triggering and Advanced Features of an Oscilloscope
To set up triggers for capturing specific memory events, you can use the advanced features of an oscilloscope. This allows you to specify conditions that must be met for the oscilloscope to start capturing data, ensuring you capture the exact memory events you’re interested in.
Additionally, you can utilize features like protocol analysis and bus decoding, which enable you to analyze the data and decode the communication protocols being used. This provides valuable insights into the memory access patterns and potential issues.
Setting up triggers for capturing specific memory events
Start by configuring the trigger settings on your oscilloscope, just like tuning a guitar string to hit the perfect note.
To capture specific memory events, you need to set up triggers that will detect and capture the desired waveforms.
First, adjust the trigger level to the appropriate voltage level that corresponds to the memory event you want to capture. This ensures that the oscilloscope triggers at the right moment.
Next, set the trigger type to edge trigger and choose the edge polarity (rising or falling) that corresponds to the memory event you’re interested in.
Additionally, you can set up advanced triggering options such as pulse width or pattern triggering to capture more specific memory access timing.
By setting up triggers correctly, you’ll be able to precisely analyze memory access timing and capture the necessary waveforms for debugging memory issues in your embedded system.
Using advanced features like protocol analysis and bus decoding
Mastering the art of analyzing memory access timing involves exploring advanced features like protocol analysis and bus decoding.
These features can provide valuable insights into the behavior of memory systems and help identify any issues or bottlenecks.
When using protocol analysis, you can decode and analyze the communication between the memory controller and the memory devices. This allows you to understand the timing and sequence of memory accesses, helping you pinpoint any anomalies or inefficiencies.
On the other hand, bus decoding allows you to decode and analyze the signals on the memory bus, providing a deeper understanding of the electrical characteristics of the memory system.
By utilizing these advanced features, you can gain a comprehensive understanding of the memory access timing and effectively debug any memory-related issues.
Troubleshoot and Resolve Memory Issues
Identify and resolve memory issues by analyzing system logs, monitoring memory usage, and optimizing memory allocation. To troubleshoot memory issues, start by analyzing system logs to identify any error messages or warning signs related to memory. This can help pinpoint the root cause of the issue. Next, monitor memory usage using tools such as an oscilloscope to identify any abnormal patterns or spikes in memory usage. This can help identify memory leaks or excessive memory usage. Finally, optimize memory allocation by analyzing the memory usage of different components and adjusting the allocation accordingly. This can involve techniques such as reducing memory fragmentation, implementing memory pooling, or using more efficient data structures. By following these troubleshooting techniques and memory optimization strategies, you can effectively resolve memory issues in embedded systems.
| Troubleshooting Techniques | Memory Optimization Strategies | |||
|---|---|---|---|---|
| Analyze system logs | Reduce memory fragmentation | |||
| Monitor memory usage | Implement memory pooling | |||
| Optimize memory allocation | Use more efficient data structures | ————————— | ——————————- | |
| Analyze system logs | Reduce memory fragmentation | |||
| Monitor memory usage | Implement memory pooling | |||
| Optimize memory allocation | Use more efficient data structures | |||
| Identify memory leaks | Minimize unnecessary memory operations |
Frequently Asked Questions
Can memory issues in embedded systems be resolved without using an oscilloscope?
To resolve memory issues in embedded systems without an oscilloscope, you can utilize alternative methods for debugging. These methods include using software tools like memory analyzers, profilers, and debuggers.
Memory analyzers can help identify memory leaks and inefficiencies, while profilers can pinpoint performance bottlenecks. Debuggers allow you to step through code and track memory usage.
By leveraging these tools and techniques, you can effectively diagnose and resolve memory issues in embedded systems without the need for an oscilloscope.
Are there any specific oscilloscope models or features that are recommended for debugging memory issues in embedded systems?
To interpret oscilloscope readings for diagnosing memory issues, consider recommended oscilloscope models or features.
Look for oscilloscopes with high bandwidth and sample rates to capture fast memory signals accurately.
Features such as deep memory and advanced triggering capabilities can help analyze complex memory patterns.
Additionally, seek oscilloscopes with built-in memory analysis tools or the ability to integrate with external memory analysis software for comprehensive debugging.
How can I differentiate between memory issues and other hardware or software issues using an oscilloscope?
To differentiate memory issues from other hardware or software issues using an oscilloscope, you can examine the waveform patterns and timing of the memory signals. Memory issues often result in inconsistent or abnormal waveforms, such as unexpected voltage levels or timing deviations.
Additionally, you can cross-validate the oscilloscope findings with other debugging tools like logic analyzers or debuggers to get a comprehensive understanding of the problem. These tools can help identify and isolate specific memory-related issues in embedded systems.
Is it possible to analyze memory access patterns in real-time using an oscilloscope?
You can analyze memory access patterns in real-time using an oscilloscope. By monitoring the memory accesses, you can identify any irregularities or inefficiencies in the system. This allows you to pinpoint the root cause of memory issues and optimize the system accordingly.
Real-time monitoring provides immediate feedback, enabling you to quickly detect and resolve any memory access problems. With precise and technical analysis, you can ensure the smooth operation of your embedded systems.
Are there any limitations or challenges when using an oscilloscope to debug memory issues in embedded systems?
When using an oscilloscope to debug memory issues in embedded systems, you may encounter some limitations and challenges.
One major limitation is the inability to directly observe the memory content. Oscilloscopes are designed to measure voltage signals, not digital data.
Additionally, the oscilloscope’s sampling rate may not be sufficient to capture fast memory access patterns.
Another challenge is the need for specialized test points or probes to access the memory signals.
These limitations and challenges can make debugging memory issues with an oscilloscope more difficult and time-consuming.
Conclusion
Congratulations! You’ve successfully navigated the intricate world of debugging memory issues in embedded systems using an oscilloscope. Just like a skilled detective unraveling a complex mystery, you’ve utilized the power of this tool to identify and resolve memory issues efficiently.
Remember, the oscilloscope is your trusty companion, providing valuable insights into memory access patterns. It allows you to trigger advanced features for a deeper analysis. Armed with this knowledge, you can now confidently troubleshoot and conquer any memory issue that comes your way.
Happy debugging!