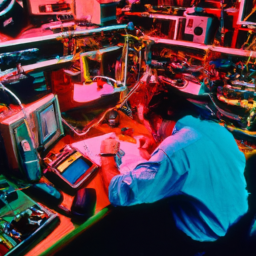
Are you an embedded systems engineer struggling to solve the puzzle of interrupt debugging? Look no further – we have the perfect tool for you: the oscilloscope. With its powerful capabilities, this device can help you uncover the hidden secrets of interrupts in your embedded systems.
In this article, we will explore the ins and outs of debugging interrupts using an oscilloscope, providing you with a step-by-step guide to unraveling their complexities.
Interrupts are crucial for efficient multitasking in embedded systems, but they can also be a source of headaches when they don’t behave as expected. By harnessing the power of an oscilloscope, you can capture and analyze interrupt signals, uncovering valuable insights into their behavior. With the ability to trigger and filter waveforms, you can pinpoint the exact moment when an interrupt occurs, allowing for precise troubleshooting.
So, join us on this journey of discovery as we dive into the world of interrupt debugging with an oscilloscope. By the end of this article, you’ll be equipped with the knowledge and techniques to confidently tackle any interrupt-related issues in your embedded systems.
Let’s get started!
Key Takeaways
- Oscilloscopes can be used by embedded systems engineers for interrupt debugging.
- Understanding interrupt handling in real-time systems is crucial for effective debugging.
- Optimizing interrupt performance requires careful configuration of timebase and trigger settings.
- Proper connection and trigger settings are important for capturing and analyzing interrupt signals.
Understand the Basics of Interrupts
Now that you’ve got your oscilloscope ready, let’s dive into understanding the basics of interrupts and how they can be debugged in embedded systems.
Interrupts are an essential component of embedded systems, allowing them to respond quickly to external events and perform time-critical tasks. However, debugging interrupts can be challenging due to their real-time nature and the need for interrupt latency optimization.
Interrupt latency optimization is crucial for reducing the time delay between the occurrence of an interrupt and its response by the system. This involves minimizing any factors that may introduce delays, such as interrupt service routines (ISRs) that take too long to execute or inefficient interrupt handling mechanisms.
To debug interrupts effectively, it is important to understand the intricacies of interrupt handling in real-time systems. This involves analyzing the flow of interrupts, identifying potential bottlenecks, and ensuring that ISRs are implemented efficiently.
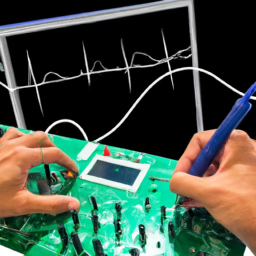
An oscilloscope can be a valuable tool in this process, allowing you to monitor and analyze the timing and behavior of interrupts in real-time, helping you identify any issues or optimize their performance.
By understanding the basics of interrupts and utilizing the capabilities of an oscilloscope, you can effectively debug interrupts in embedded systems and ensure their optimal performance.
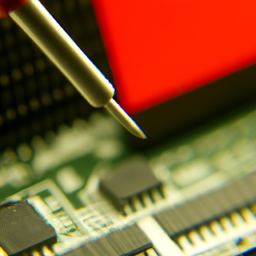
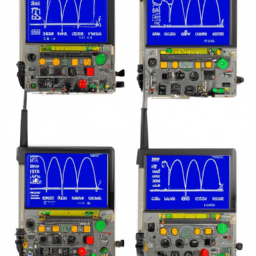
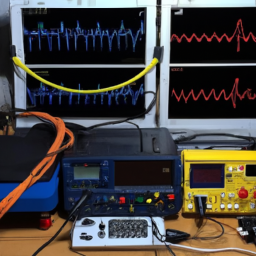
Set Up Your Oscilloscope for Interrupt Debugging
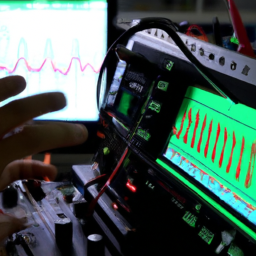
To get your oscilloscope ready for diving into the intricate world of interrupt debugging, equip it with the gear of precision and unleash its power to unravel the secrets hidden within your embedded creation.
When setting up your oscilloscope for interrupt debugging, it’s crucial to address common oscilloscope problems that may arise. Ensure that the oscilloscope is properly calibrated, as any inaccuracies can lead to misleading results.
Additionally, pay attention to the probe impedance and ensure it’s properly matched to the circuit under test to avoid signal degradation. Another common issue is noise interference, so it’s essential to minimize external disturbances by using proper grounding techniques and shielding.
Optimizing interrupt performance requires careful consideration of various factors. Start by setting the oscilloscope’s timebase and trigger settings to capture the interrupt signals accurately. You may need to adjust the triggering level to ensure the oscilloscope captures the desired signals.
It’s also beneficial to use multiple channels to observe different aspects of the interrupt behavior simultaneously. By carefully configuring and utilizing your oscilloscope, you can effectively debug interrupts and uncover any hidden issues within your embedded system.
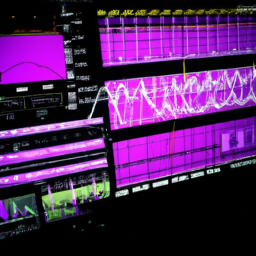
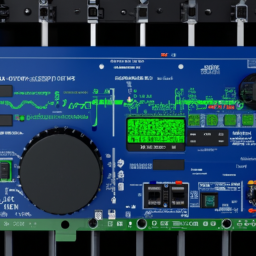
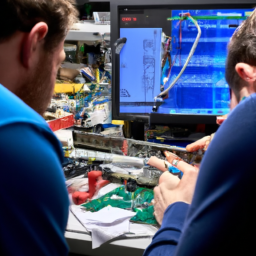
Capture and Analyze Interrupt Signals
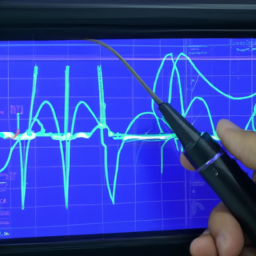
Equip your oscilloscope with the necessary tools and dive into the intricate world of interrupt debugging by capturing and analyzing the mesmerizing signals that unveil the hidden secrets of your creation.
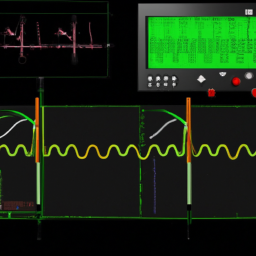
To effectively capture and analyze interrupt signals, ensure your oscilloscope is properly connected to the interrupt source. Set the trigger level and select the appropriate trigger type to capture the desired interrupt signals.
Once captured, carefully analyze the signals to understand the interrupt behavior and identify any anomalies.
Analyze interrupt latency by measuring the time between the interrupt request and the corresponding response from the system. This will help you identify potential bottlenecks and optimize interrupt handling for improved system performance.
By closely examining the captured signals and analyzing interrupt latency, you can gain valuable insights into the functioning of your embedded system and make necessary optimizations to ensure smooth and efficient interrupt handling.
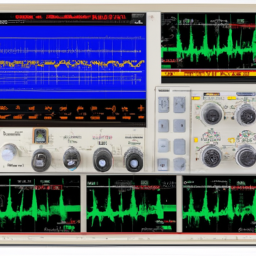
Use Triggering and Filtering Techniques
Ensure your oscilloscope is properly connected to the interrupt source, so you can delve into the intricate world of interrupt debugging and witness the symphony of signals that paint a vivid picture of your creation, like a skilled conductor unraveling the complex harmony of an orchestra.
To effectively debug interrupts, you need to utilize triggering techniques and filtering methods.
Triggering techniques help you capture the specific interrupt event you’re interested in. You can set your oscilloscope to trigger on a rising or falling edge, or even on a specific data pattern. This allows you to isolate the interrupt signal and analyze it in detail.
Filtering methods are crucial for eliminating noise and unwanted signals that could interfere with your analysis. You can use low-pass filters to remove high-frequency noise or bandpass filters to focus on a specific frequency range.
By employing these triggering techniques and filtering methods, you can effectively debug interrupts and gain valuable insights into the behavior of your embedded system.
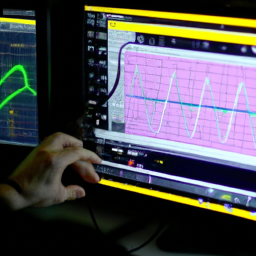
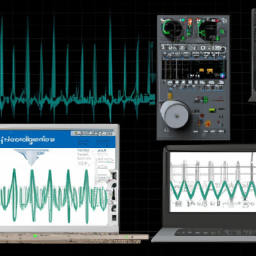
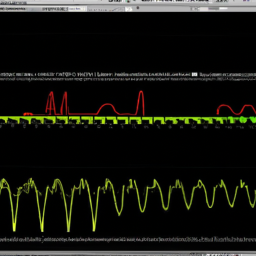
Interpret and Troubleshoot Interrupt Waveforms
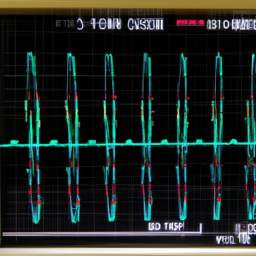
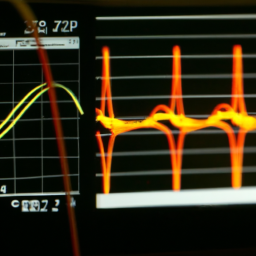
Interpreting and troubleshooting interrupt waveforms can be like deciphering a complex code, as you unravel the intricate dance of signals that reveal the inner workings of your creation. When analyzing interrupt waveforms on an oscilloscope, it’s important to look for certain patterns and anomalies that could indicate common interrupt issues.
For example, you might notice unexpected spikes or glitches in the waveform, which could suggest problems with electrical noise or improper grounding. By carefully examining the timing and duration of the interrupts, you can also optimize interrupt performance. Adjusting the interrupt priorities or modifying the interrupt service routines may help to minimize latency and ensure a timely response to critical events.
With a keen eye for detail and a systematic approach to troubleshooting, you can effectively debug interrupts using an oscilloscope.
Implement Solutions and Verify Interrupt Functionality
Now, let’s dive into how to put our solutions into action and confirm that our interrupts are functioning properly.
When it comes to debugging techniques for interrupts in embedded systems, one critical step is testing interrupt handlers. These handlers are responsible for executing specific tasks when an interrupt occurs.
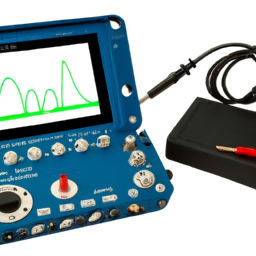
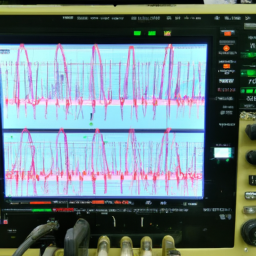
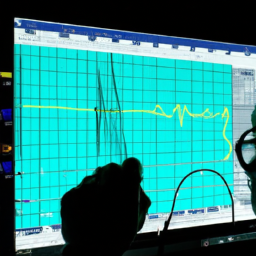
To verify their functionality, you need to simulate the interrupt condition and observe the response using an oscilloscope. Start by setting up your test environment, ensuring that the interrupt source and handler are correctly configured.
Then, generate the interrupt signal and observe the waveform on the oscilloscope. Pay close attention to the timing and duration of the interrupt, as well as any anomalies.
Compare the observed waveform with the expected behavior to identify any discrepancies. By carefully testing and analyzing the interrupt handlers, you can ensure that they’re correctly implemented and functioning as intended.
Frequently Asked Questions
Can I use any oscilloscope to debug interrupts in embedded systems?
Yes, you can use alternative tools for debugging interrupts in embedded systems, especially if you don’t have access to an oscilloscope. While an oscilloscope provides detailed waveform analysis, there are other options available.
For example, you can use a logic analyzer to capture and analyze digital signals, or a debugger connected to the microcontroller to trace and monitor interrupts. These tools offer different perspectives and insights, allowing you to effectively debug interrupts without relying solely on an oscilloscope.
How can I determine the priority level of different interrupts?
To determine the priority level of different interrupts in embedded systems, start by identifying the interrupt sources. Consult the system’s interrupt vector table to find the priority level assigned to each interrupt source.
This table maps each interrupt source to its corresponding priority level. By analyzing this information, you can determine the priority order in which the interrupts will be serviced by the microcontroller.
This knowledge is crucial for understanding the behavior of the system and optimizing its performance.
What are some common sources of interrupt conflicts in embedded systems?
Interrupt conflicts in embedded systems can arise from various sources, such as multiple interrupts occurring simultaneously or conflicting interrupt priorities. Resolving these conflicts requires interrupt conflict resolution techniques. These techniques include prioritization schemes and interrupt masking. Troubleshooting interrupt latency can also help identify conflicts. By analyzing the timing and duration of interrupts using an oscilloscope, you can pinpoint potential conflicts and make necessary adjustments to ensure smooth operation of your embedded system.
Is it possible to debug interrupts without an oscilloscope?
Yes, it’s possible to debug interrupts without an oscilloscope. Debugging interrupts using software tools is an alternative method. You can use a debugger to step through the interrupt code and analyze its behavior. This allows you to track the flow of execution and identify any issues or conflicts.
Additionally, you can use logging or tracing techniques to gather information about the interrupt handling process. These methods can provide valuable insights into interrupt-related problems without the need for an oscilloscope.
Are there any specific techniques for debugging hard faults caused by interrupts?
When it comes to debugging hard faults caused by interrupts, there are specific techniques you can employ.
First, analyze the interrupt conflicts by carefully examining the code and identifying any potential clashes.
Next, use a systematic approach to isolate the problem area and narrow down the possible causes. This may involve utilizing debuggers, log files, and diagnostic tools.
By diligently following these steps, you can effectively debug hard faults and ensure smooth interrupt handling in your embedded system.
Conclusion
In conclusion, you’ve now learned how to effectively debug interrupts in embedded systems using an oscilloscope. By understanding the basics of interrupts and setting up your oscilloscope correctly, you were able to capture and analyze interrupt signals.
Through the use of triggering and filtering techniques, you gained valuable insights and successfully interpreted and troubleshooted interrupt waveforms.
Armed with this knowledge, you can now implement solutions and verify the functionality of interrupts in your embedded systems. Happy debugging!