You may be thinking, ‘Debugging I/O issues in embedded systems with an oscilloscope sounds complicated and time-consuming.’ But let me assure you, with the right knowledge and tools, it can be a straightforward and efficient process.
In this article, we will guide you through the steps of debugging I/O issues in embedded systems using an oscilloscope.
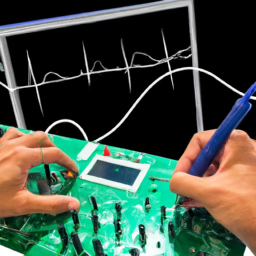
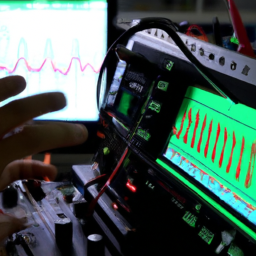
Embedded systems rely heavily on input and output (I/O) processes to communicate with the external world. When these I/O processes encounter issues, it can be challenging to identify and resolve the root cause. Enter the oscilloscope – a powerful tool that allows you to visualize and analyze electrical signals.
We will start by providing a solid understanding of I/O in embedded systems. Then, we will walk you through the setup process of your oscilloscope for I/O debugging.
We will cover the effective capture and analysis of I/O signals, utilizing advanced features for deeper analysis. Additionally, we will share troubleshooting techniques to help you quickly identify and resolve I/O issues.
By the end of this article, you will have a clear roadmap on how to debug I/O issues in embedded systems using an oscilloscope. So let’s dive in and gain the expertise needed to tackle these challenges with confidence.
Key Takeaways
- Understanding I/O protocols like UART, SPI, and I2C is crucial for effective debugging of embedded systems with an oscilloscope.
- Properly configuring and utilizing the oscilloscope, including connecting the probe, adjusting settings, and using triggering options, is essential for accurate analysis of I/O waveforms.
- Troubleshooting I/O issues involves systematic analysis, utilizing measurement tools on the oscilloscope, and ruling out potential causes step by step to identify the root cause of the problem.
- Implementing preventive measures such as firmware updates, optimizing hardware configurations, proper circuit board design, and regular maintenance can help reduce the chances of encountering I/O issues in embedded systems.
Understand the Basics of I/O in Embedded Systems
To truly grasp the intricacies of I/O in embedded systems, you should familiarize yourself with the fundamental principles and concepts underlying their operation.
I/O protocols play a crucial role in the communication between the embedded system and the external devices it interacts with. Understanding the different protocols, such as UART, SPI, and I2C, will enable you to effectively diagnose and debug I/O issues.
Common I/O issues in embedded systems include data corruption, signal integrity problems, and incorrect voltage levels. By using an oscilloscope, you can analyze the waveforms and signals involved in the I/O process. This allows you to identify anomalies, such as noise, glitches, or improper timing.
With a thorough understanding of I/O principles and the right tools, you can effectively troubleshoot and resolve I/O issues in embedded systems.
Set Up Your Oscilloscope for I/O Debugging
Prepare your oscilloscope for troubleshooting input/output problems in your embedded setup.
To effectively debug I/O issues, you need to configure your oscilloscope properly. Here’s how you can do it:
-
Connect the oscilloscope probe to the signal you want to analyze. Make sure the probe ground is properly connected.
-
Adjust the oscilloscope settings, such as timebase, voltage scale, and trigger level, to capture the desired waveform accurately.
-
Use the oscilloscope’s triggering options to stabilize and isolate the waveform you want to interpret.
-
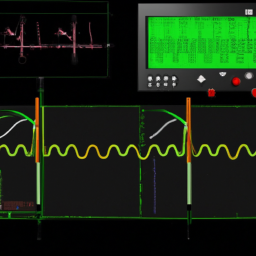
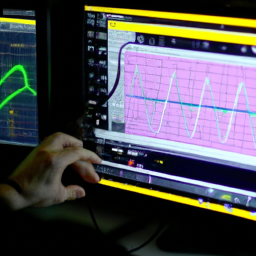
Analyze the I/O waveforms displayed on the oscilloscope screen, looking for anomalies, glitches, or unexpected behavior.
Interpreting the I/O waveforms correctly is crucial in identifying and resolving issues. Look for signal integrity problems, timing issues, noise, or distortion.
By following these steps and carefully examining the waveforms, you can effectively debug I/O issues in your embedded system.
Capture and Analyze I/O Signals
Adjusting the settings on your oscilloscope while connecting the probe to the signal you want to analyze enables you to capture and interpret I/O waveforms accurately, allowing you to identify any anomalies or unexpected behavior in the signals. To further enhance your understanding of the signals, you can utilize a table to organize the data and provide a deeper meaning. Here is an example of a 3 column and 5 row table that can be used for I/O signal interpretation:
| Time (s) | Voltage (V) | Signal |
|---|---|---|
| 0 | 0 | Low |
| 1 | 5 | High |
| 2 | 0 | Low |
| 3 | 5 | High |
| 4 | 0 | Low |
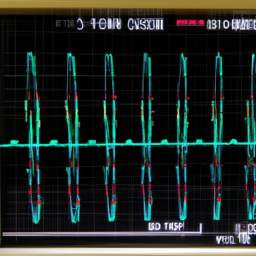
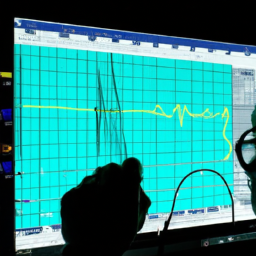
By capturing and monitoring the I/O signals in real time, you have the advantage of visualizing the data as it happens. This real-time data visualization allows you to quickly detect any abnormalities or unexpected patterns, facilitating the debugging process.
Use Advanced Features of the Oscilloscope for Deep Analysis
Once you’ve got a good handle on capturing and analyzing I/O signals, it’s time to dive deeper into the capabilities of your oscilloscope and unlock its advanced features for a more thorough analysis, like peeling back the layers of an onion.
Advanced waveform analysis and signal integrity troubleshooting are crucial in identifying and resolving I/O issues in embedded systems.
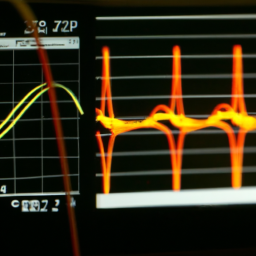
With advanced waveform analysis, you can go beyond basic measurements and delve into the intricate details of your signals. Features like fast Fourier transform (FFT) and math functions enable you to analyze frequency content, perform mathematical operations, and extract valuable insights. By examining harmonics, noise, and distortion, you can diagnose signal anomalies and pinpoint their sources.
Signal integrity troubleshooting is another powerful tool in your arsenal. With features like eye diagrams, jitter analysis, and noise measurements, you can assess the quality of your signals and identify any impairments or distortions. This enables you to optimize your I/O paths, minimize data corruption, and ensure reliable communication between your embedded system and external devices.
By utilizing the advanced features of your oscilloscope, you can perform a deep analysis of I/O signals, uncover hidden issues, and ultimately enhance the overall performance and reliability of your embedded system. So, don’t hesitate to explore and utilize these advanced capabilities to unlock the full potential of your oscilloscope.
Troubleshoot and Debug I/O Issues
To troubleshoot and debug I/O issues, you need to identify the potential sources of the problem. These sources may include incorrect voltage levels, noise interference, or faulty connections. Once you have identified these potential sources, you can use the oscilloscope to pinpoint the root cause. This can be done by analyzing the signals and waveforms. By carefully examining the data, you can determine the exact location and nature of the problem. With this information, you can then implement effective solutions to resolve the I/O issues. This will ensure the smooth operation of your embedded system.
Identify Potential Sources of I/O Problems
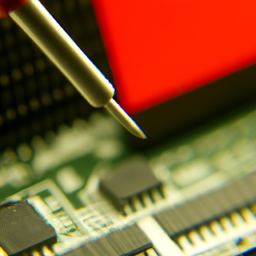
Start by carefully examining the connections and cables between your embedded system and the peripheral devices, ensuring that they are securely plugged in and free from any visible damage or loose connections. Common I/O problems can often be traced back to faulty or poorly connected cables. Next, check for any potential sources of interference, such as nearby power sources or electromagnetic fields. These can disrupt the I/O signals and cause communication issues. Additionally, review the software configuration and settings related to the I/O devices. Ensure that the correct drivers are installed and that the settings are properly configured for your specific application. Finally, utilize troubleshooting techniques such as signal analysis with an oscilloscope to monitor the I/O signals and identify any anomalies. By systematically addressing these potential sources of I/O problems, you can effectively debug and resolve any issues in your embedded system.
| Potential Sources of I/O Problems | Troubleshooting Techniques | |||
|---|---|---|---|---|
| Faulty or loose connections | Signal analysis | |||
| Interference | Faulty driver detection | |||
| Software configuration | Signal monitoring | |||
| Improper settings | Error logging | ———————————- | ————————— | |
| Faulty or loose connections | Signal analysis | |||
| Interference | Faulty driver detection | |||
| Software configuration | Signal monitoring | |||
| Improper settings | Error logging | |||
| ———————————- | ————————— |
In order to address these issues, appropriate troubleshooting techniques can be employed. These techniques include diagnosing and rectifying faulty or loose connections through signal analysis, detecting and resolving interference through faulty driver detection, configuring software settings properly through signal monitoring, and identifying and fixing improper settings through error logging. By utilizing these techniques, the root causes of the problems can be identified and resolved effectively.
Use the Oscilloscope to Pinpoint the Root Cause
Don’t miss out on the incredible power of the oscilloscope to pinpoint the exact root cause of your I/O problems! When it comes to identifying signal anomalies and troubleshooting issues in embedded systems, the oscilloscope is your best friend.
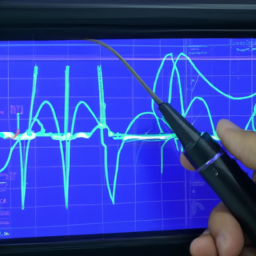
By capturing and displaying waveforms, it allows you to interpret the behavior of your signals with precision and accuracy.
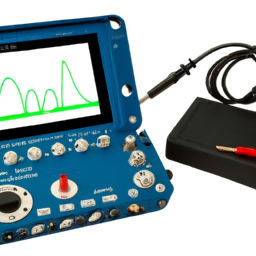
To begin, connect the oscilloscope probe to the I/O pin you suspect is causing the problem. Set the oscilloscope to the appropriate voltage and time scales, ensuring that the waveform is clearly visible on the screen. Pay close attention to the shape, amplitude, frequency, and timing of the waveform.
Next, compare the observed waveform with the expected one. Look for any discrepancies or abnormalities that might indicate a potential issue. Are there unexpected spikes, noise, or distortions present? Analyze the waveform in detail, using measurement tools provided by the oscilloscope, such as cursors and markers, to quantify any deviations.
As you pinpoint signal anomalies and interpret oscilloscope waveforms, keep in mind that the root cause of your I/O problem might not always be immediately obvious. It could be due to various factors, such as noise, improper signal conditioning, or even faulty components. Therefore, it’s crucial to be systematic and methodical in your analysis, ruling out potential causes one by one.
By utilizing the power of an oscilloscope, you can confidently identify and address the root cause of your I/O problems. Remember to carefully examine and interpret the waveforms captured by the oscilloscope, comparing them to the expected behavior. With a technical and precise approach, you can successfully troubleshoot and debug I/O issues in your embedded systems.
Implement Solutions to Resolve I/O Issues
Now that you’ve identified the root cause of your I/O problems, it’s time to implement solutions and resolve the issues at hand.
Start by implementing firmware updates to address any software-related issues. This involves updating the firmware on the embedded system to the latest version provided by the manufacturer or developer. Firmware updates often include bug fixes, performance improvements, and compatibility enhancements that can help resolve I/O problems.
Next, optimize hardware configurations to ensure proper I/O functionality. This may involve adjusting signal levels, ensuring proper grounding, and checking for any hardware defects or malfunctions. Use the oscilloscope to monitor and analyze the I/O signals to verify that the changes made are effective in resolving the issues.
Remember to document all changes made and their impact on the I/O performance. This will help in future troubleshooting and provide valuable insights for similar issues that may arise.
Best Practices for Preventing I/O Issues in Embedded Systems
To ensure smooth sailing in the realm of embedded systems, it’s absolutely crucial to embrace the mantra of ‘prevention is better than cure’ and take proactive measures to ward off pesky I/O issues. Here are some best practices for preventing hardware failures and optimizing I/O performance:
-
Properly design and layout your circuit boards to minimize noise and interference.
-
Use high-quality components and ensure they’re properly rated for the intended use.
-
Implement proper grounding techniques to minimize ground loops and noise.
-
Regularly inspect and clean connectors and cables to prevent corrosion and ensure good electrical connections.
-
Perform thorough testing and validation of your I/O subsystems before deployment to identify any potential issues.
By following these best practices, you can significantly reduce the chances of encountering I/O issues in your embedded systems, ensuring reliable and efficient operation.
Frequently Asked Questions
Can I use a multimeter instead of an oscilloscope for I/O debugging in embedded systems?
Using a multimeter for I/O debugging in embedded systems has its pros and cons. The main advantage is its simplicity and lower cost compared to an oscilloscope. A multimeter can measure voltage, current, and resistance, providing basic information about the signals. However, it lacks the ability to capture and analyze waveforms, making it less effective for diagnosing complex issues. Additionally, it may not be suitable for high-speed or digital signals.
What are some common causes of I/O issues in embedded systems?
I/O issues in embedded systems can be frustrating, but understanding the common causes can help you troubleshoot effectively. One common cause is improper voltage levels, which can lead to unreliable communication.
Another cause is incorrect timing, where signals are not synchronized properly.
Grounding issues can also cause I/O problems.
To prevent these issues, it’s important to follow best practices such as using proper voltage levels, ensuring accurate timing, and ensuring a solid ground connection.
How can I differentiate between software and hardware-related I/O issues?
To differentiate between software and hardware-related I/O issues in embedded systems, you can employ various troubleshooting techniques.
Firstly, analyze the system’s behavior and identify any patterns or inconsistencies.
Next, check for any software bugs or errors that may be causing the issue.
If the problem persists, focus on the hardware components by inspecting connections, cables, and peripheral devices.
By following this methodical approach, you can pinpoint the root cause and resolve the I/O issue effectively.
Are there any limitations or constraints to consider when using an oscilloscope for I/O debugging?
When using an oscilloscope for I/O debugging, there are several potential drawbacks and limitations to consider.
One important consideration is the scope accuracy, as it may not always provide precise measurements.
Additionally, the oscilloscope’s bandwidth may restrict its ability to capture high-frequency signals accurately.
Another limitation is the need for proper probe grounding and signal connections, which can be challenging in embedded systems.
Overall, it’s crucial to be aware of these limitations and consider alternative methods if necessary.
Can you recommend any specific oscilloscope models or brands that are particularly well-suited for I/O debugging in embedded systems?
When it comes to i/o debugging in embedded systems, using an oscilloscope can be highly advantageous. Recommended oscilloscope models for this purpose include the Tektronix TBS1000 series and the Keysight InfiniiVision 3000T X-Series. These models offer high bandwidth, fast sampling rates, and deep memory, allowing for accurate and detailed analysis of I/O signals.
By capturing and analyzing waveforms, an oscilloscope can help identify issues such as signal integrity problems, timing violations, and noise interference, making it an invaluable tool for debugging I/O issues in embedded systems.
Conclusion
So there you have it, a comprehensive guide on how to debug I/O issues in embedded systems using an oscilloscope. By understanding the basics of I/O, setting up your oscilloscope correctly, capturing and analyzing signals, and utilizing advanced features for deep analysis, you can effectively troubleshoot and debug any I/O issues you may encounter.
Remember, prevention is always better than cure, so follow the best practices outlined here to minimize the occurrence of I/O issues in your embedded systems. With these techniques, you’ll be able to navigate the complex world of I/O debugging with confidence and precision, ensuring optimal performance and functionality in your embedded systems.
Happy debugging!