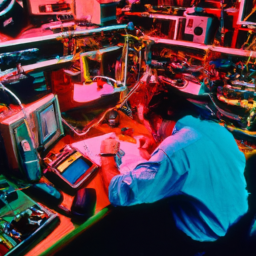
Are you lost in the tangled web of multiple processors within your embedded system? Like a skilled detective armed with an oscilloscope, you can unravel the mysteries and bring order to the chaos. Debugging embedded systems with multiple processors may seem like a daunting task, but fear not, for we have the tools and techniques to guide you on this intricate journey.
In this article, we will delve into the depths of embedded systems, exploring their fundamentals and uncovering the secrets of their inner workings. With your trusty oscilloscope by your side, we will walk you through the setup process, ensuring you are equipped to capture and analyze the crucial data needed for effective debugging.
But it doesn’t stop there. We will also dive into the realm of issue identification and resolution, equipping you with the knowledge and techniques to overcome the challenges that may arise during the debugging process. And to top it all off, we will share best practices specifically tailored for debugging embedded systems with multiple processors.
So, grab your oscilloscope and get ready to embark on a thrilling adventure of debugging mastery. Let’s unravel the mysteries together!
Key Takeaways
- Oscilloscopes are powerful tools for debugging embedded systems with multiple processors.
- Proper configuration of the oscilloscope is crucial for effective debugging.
- Capturing and analyzing data with triggers helps reduce noise and focus on relevant information.
- Advanced analysis tools on the oscilloscope, such as protocol decoding and bus analysis, can provide insights into system behavior and identify communication issues.
Understanding the Basics of Embedded Systems
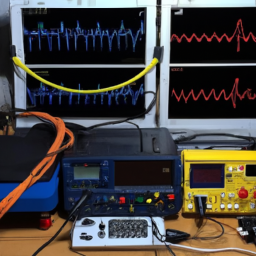
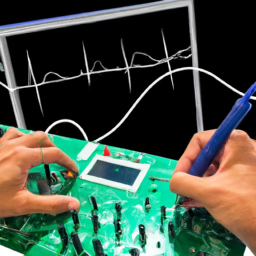
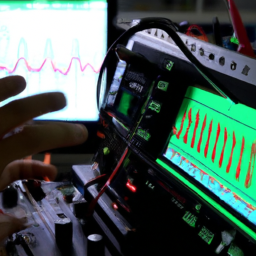
When debugging embedded systems with multiple processors, using an oscilloscope can greatly aid in identifying and resolving issues. An oscilloscope is a powerful tool that allows you to visualize and analyze the behavior of electrical signals.
It provides detailed waveform representations, enabling you to observe the timing, voltage levels, and frequency of signals. This can help pinpoint problems and optimize system performance.
There are various types of oscilloscopes available, each with its own unique features and capabilities. These include bandwidth, sample rate, and memory depth. These features allow you to choose the most suitable oscilloscope for your specific debugging needs.
Overview of Oscilloscope Functionality
To fully appreciate the capabilities of an oscilloscope, it’s essential to understand its overview and how it can enhance your debugging process in embedded systems with multiple processors. Here’s an overview of the functionality of an oscilloscope:
-
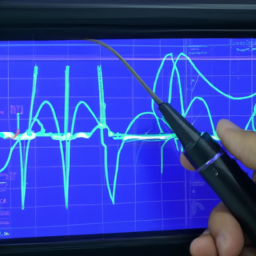
Real-time waveform visualization: An oscilloscope allows you to see the electrical signals in your system in real-time, helping you identify any anomalies or irregularities.
-
Triggering and event capture: You can set triggers to capture specific events or signals, making it easier to isolate and analyze problematic areas in your system.
-
Measurement and analysis tools: Oscilloscopes offer a wide range of measurement tools such as voltage, frequency, and time measurements. These tools provide valuable insights into the behavior of your system.
-
Advanced features for troubleshooting: Oscilloscopes come with advanced features like serial decoding and protocol analysis, which can help you troubleshoot common issues related to communication protocols.
By exploring these advanced oscilloscope features and troubleshooting common oscilloscope issues, you can effectively debug embedded systems with multiple processors.
Types of Oscilloscopes and their Features
Immerse yourself in the world of oscilloscopes as you explore the different types available and discover the exciting features they offer, making your debugging process a visual and interactive experience.
There are two main types of oscilloscopes: digital oscilloscopes and analog oscilloscopes.
Digital oscilloscopes use an analog-to-digital converter to convert the input signal into digital data, allowing for more precise measurements and advanced features such as waveform analysis and automatic measurements. They also offer a higher bandwidth and sample rate compared to analog oscilloscopes.
On the other hand, analog oscilloscopes use a cathode-ray tube (CRT) to display the waveform directly, providing a real-time representation of the signal. They are often preferred for their simplicity, affordability, and ability to capture fast transients.
Both types of oscilloscopes have their own advantages and choosing the right one depends on your specific debugging requirements.
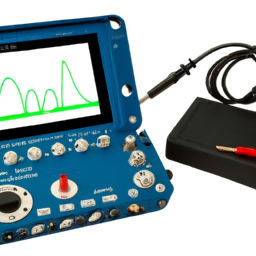
Setting Up the Oscilloscope for Debugging
First, make sure the oscilloscope is properly configured for debugging purposes in embedded systems with multiple processors. This involves troubleshooting common oscilloscope errors and optimizing oscilloscope settings for different embedded systems.
To troubleshoot common oscilloscope errors, start by checking the connections between the oscilloscope and the embedded system. Ensure that all cables are securely connected and that the oscilloscope is properly grounded. Next, verify that the oscilloscope is set to the correct voltage range and timebase settings for the signals being measured.
To optimize oscilloscope settings for different embedded systems, consider the specific requirements of each system. Adjust the trigger settings to capture the desired signals and adjust the waveform display to clearly visualize the signal details. Use the oscilloscope’s advanced features, such as math functions and measurements, to analyze the captured waveforms and extract valuable insights.
Overall, taking the time to properly configure the oscilloscope for debugging purposes is crucial in effectively troubleshooting and analyzing embedded systems with multiple processors.
Capturing and Analyzing Data
To capture relevant data using triggers, you’ll need to set up the oscilloscope to detect specific events or conditions that you’re interested in. This allows you to capture only the data that’s relevant to your analysis, reducing noise and unnecessary information.
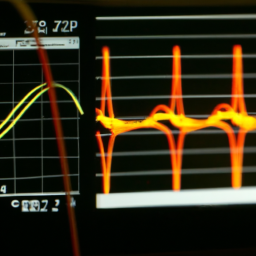
Once the data is captured, you can analyze it using waveform measurements and analysis tools provided by the oscilloscope. These tools allow you to measure various parameters of the waveform, such as amplitude, frequency, and rise time, and perform advanced analysis such as FFT, eye diagram, and histogram.
Using Triggers to Capture Relevant Data
Utilize triggers on your oscilloscope to precisely pinpoint pertinent data while debugging embedded systems with multiple processors. Oscilloscope triggers allow you to capture specific events or conditions, helping you troubleshoot common issues effectively. By setting up triggers, you can automatically capture waveforms when specific criteria are met, such as voltage thresholds, edge triggering, or pulse widths. This ensures that you capture the relevant data and avoid overwhelming your oscilloscope’s memory with unnecessary information.
To illustrate the effectiveness of using triggers, consider the following table:
| Trigger Type | Description | Application |
|---|---|---|
| Edge Trigger | Captures waveform when the voltage crosses a specified threshold | Detecting glitches or timing issues |
| Pulse Width Trigger | Captures waveform when the pulse width falls within a specified range | Analyzing signal integrity or duty cycle |
| Pattern Trigger | Captures waveform when a specific pattern is detected | Identifying communication errors or protocol issues |
By utilizing these trigger types, you can efficiently capture and analyze the data needed to troubleshoot and debug embedded systems with multiple processors.
Analyzing Data with Waveform Measurements and Analysis Tools
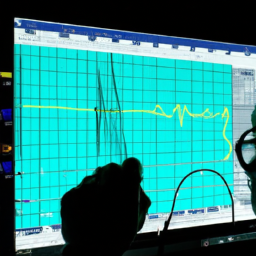
Now that you’ve successfully captured the relevant data using triggers, it’s time to dive into analyzing that data using waveform measurements and analysis tools. This is where the true power of an oscilloscope shines.
With the ability to make precise measurements and analyze waveforms in real time, you can quickly identify anomalies and troubleshoot issues in your embedded system. Oscilloscopes offer a wide range of analysis tools, such as cursors, measurements, and math functions, that allow you to extract valuable information from the captured waveforms.
By utilizing these tools, you can measure and compare signal characteristics, detect glitches, and identify timing issues. Additionally, you can perform advanced analysis techniques like Fast Fourier Transform (FFT) to analyze the frequency components of your signals.
These troubleshooting techniques, when combined with the oscilloscope’s real-time debugging capabilities, enable you to efficiently debug and optimize your embedded systems.
Identifying and Resolving Issues
When troubleshooting embedded systems with multiple processors using an oscilloscope, it’s essential to identify and resolve issues in a systematic and efficient manner. Common issues that may arise include communication errors between processors, synchronization problems, and timing issues. To address these problems, you can employ various troubleshooting techniques. First, check the communication lines and ensure they are properly connected and functioning. Use the oscilloscope to monitor the signals and look for any abnormalities or inconsistencies. Additionally, analyze the timing diagrams to verify that the processors are synchronized correctly. If timing problems are detected, adjust the clock settings and retest. By utilizing these troubleshooting techniques, you can effectively identify and resolve issues in embedded systems with multiple processors, ensuring optimal performance and functionality.
| Common Issues | Troubleshooting Techniques | |||
|---|---|---|---|---|
| Communication errors | Check connections, monitor signals, and verify protocols. | |||
| Synchronization problems | Analyze timing diagrams, adjust clock settings. | |||
| Timing issues | Verify clock settings, retest after adjustments. | |||
| Abnormalities or inconsistencies in signals | Monitor signals using the oscilloscope, analyze waveforms for anomalies. | Abnormalities or inconsistencies in signals | Monitor signals using the oscilloscope, analyze waveforms for anomalies, and troubleshoot the source of the issue. |
Best Practices for Debugging Embedded Systems with Multiple Processors
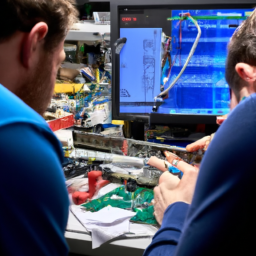
To effectively troubleshoot and resolve issues in your embedded system, imagine yourself as a detective carefully examining the intricate web of interconnected components, searching for clues and following the trail of signals to pinpoint the source of any abnormalities or inconsistencies.
When debugging embedded systems with multiple processors, there are several best practices that can help you optimize performance and streamline the process. Firstly, make sure to thoroughly understand the system architecture and the interactions between the processors. This will help you identify potential bottlenecks or areas of concern.
Additionally, use breakpoints and watchpoints strategically to halt the processors at specific points in the code execution, allowing you to analyze the state of the system at that moment. Utilize the oscilloscope’s triggering capabilities to capture specific events or signals of interest.
Furthermore, leverage the oscilloscope’s advanced analysis tools, such as protocol decoding and bus analysis, to gain insights into the system’s behavior and identify communication issues between processors.
Finally, document your findings and any changes made during the debugging process, as this will help you track progress and ensure future debugging efforts are more efficient.
By following these debugging techniques and optimizing the performance of your embedded system, you can effectively resolve issues and ensure smooth operation.
Frequently Asked Questions
How do I choose the right oscilloscope for debugging embedded systems with multiple processors?
To choose the right oscilloscope for debugging embedded systems with multiple processors, you need to first understand the requirements of such debugging. Consider factors like the number of channels needed, sample rate, bandwidth, and memory depth.
Multiple processors may require simultaneous monitoring, so look for an oscilloscope with multi-channel capabilities. Additionally, consider the oscilloscope’s triggering options and software support for analyzing and decoding embedded protocols.
What are the common challenges faced when debugging embedded systems with multiple processors?
When debugging embedded systems with multiple processors, you may encounter common challenges that require effective troubleshooting techniques. These challenges include communication issues between processors, synchronization problems, and timing conflicts.
To overcome these hurdles, you can employ techniques like signal tracing, bus analysis, and event triggering. By meticulously analyzing the signals and events, you can identify the root cause of the issues and resolve them efficiently, ensuring smooth operation of your embedded system.
Can I use the same oscilloscope setup for debugging both hardware and software issues in embedded systems?
Yes, you can use the same oscilloscope setup for debugging both hardware and software issues in embedded systems. Using an oscilloscope for real-time debugging offers several benefits. It allows you to analyze waveform signals and measure voltage levels. It also helps you monitor timing between different components, identify and troubleshoot problems related to power supply, signal integrity, timing issues, and communication protocols. Additionally, an oscilloscope provides a visual representation of the system’s behavior, making it easier to pinpoint and resolve issues efficiently.
How can I effectively analyze the captured data from the oscilloscope to identify potential issues?
To effectively analyze the captured data from the oscilloscope and identify potential issues, you’ll need to employ various troubleshooting techniques.
Start by carefully examining the waveform patterns and comparing them to expected values. Look for anomalies or inconsistencies that may indicate hardware or software issues.
Use the oscilloscope’s measurement and analysis features to quantify and analyze key parameters such as frequency, amplitude, and timing.
Additionally, cross-reference the captured data with system documentation and specifications. This can provide valuable insights for troubleshooting.
Remember to take note of any complete concepts on their own lines, with a double new line after each one.
Are there any specific techniques or strategies that can help improve the efficiency of debugging embedded systems with multiple processors?
To improve the efficiency of debugging embedded systems with multiple processors, utilize parallel debugging strategies and real-time trace analysis techniques.
Parallel debugging involves debugging multiple processors simultaneously, reducing the overall debugging time.
Real-time trace analysis techniques enable the capture and analysis of data in real-time, providing valuable insights into system behavior.
These techniques help identify potential issues quickly and efficiently, allowing for faster resolution of problems and improved overall system performance.
Conclusion
In conclusion, debugging embedded systems with multiple processors can be a complex task, but it can be made more manageable with the right tools and techniques. By utilizing an oscilloscope and following best practices, such as setting up the instrument correctly and capturing and analyzing data effectively, you can identify and resolve issues efficiently.
Remember, debugging is like solving a puzzle, and with patience and perseverance, you can uncover the hidden bugs and ensure the smooth operation of your embedded systems. Happy debugging!