Imagine you’re an explorer navigating uncharted territory, armed with only your wits and a trusty map. As you traverse the unknown, you encounter obstacles and challenges that threaten to derail your journey. But fear not, for you possess a powerful tool – an oscilloscope – capable of unraveling the mysteries of communication protocols in embedded systems.
In the world of embedded systems, communication protocols are the lifeblood that enables devices to exchange information and function seamlessly. However, when issues arise, troubleshooting these protocols can seem like deciphering an ancient code. That’s where your oscilloscope comes in. With its ability to capture and analyze signals, you can become a detective, uncovering the root cause of communication failures and resolving them with precision.
In this article, we will delve into the art of debugging communication protocols using an oscilloscope. From understanding the basics of protocols to utilizing advanced features and tools, we will equip you with the knowledge and skills needed to conquer any protocol-related challenge.
So grab your oscilloscope and join us on this exciting journey into the depths of embedded systems debugging.
Key Takeaways
- Communication protocols play a crucial role in embedded systems and their proper understanding is essential for effective debugging.
- Troubleshooting communication protocols can be challenging due to various external factors affecting communication reliability.
- Configuring and calibrating the oscilloscope correctly is important for accurate measurements and data capture during debugging.
- Utilizing advanced features like protocol decoding and triggering options can provide valuable insights and help in identifying and resolving communication problems more efficiently.
Understand the Basics of Communication Protocols
Now, imagine how much easier debugging communication protocols in embedded systems will be once you understand the basics.
Common communication protocol examples include I2C, SPI, UART, and CAN. These protocols are used to establish communication between different components in embedded systems.
However, debugging these protocols can be challenging due to various factors. One challenge is the complexity of the protocols themselves, as they often involve intricate timing requirements and specific data formats. Another challenge is the interaction between hardware and software, as issues can arise from both sides.
Additionally, external factors such as noise and interference can affect the reliability of the communication. Understanding the basics of communication protocols is essential for effective debugging, as it enables you to identify and resolve issues in a systematic and efficient manner.
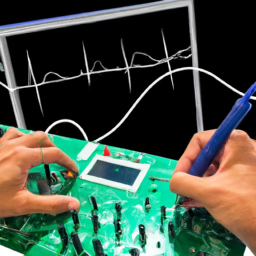
Set Up Your Oscilloscope Properly
Ensure you’ve got your oscilloscope properly configured to maximize your debugging potential and get those communication protocols running smoothly. Start by calibrating your oscilloscope to ensure accurate measurements. This involves adjusting the internal settings to match known voltage and time references. Once calibrated, select the appropriate oscilloscope probe for your specific needs. The probe should have a sufficient bandwidth to capture the high-frequency signals of your communication protocol. Consider factors such as probe impedance and attenuation ratio when choosing the probe. Use a table to compare different probe options, including their bandwidth, attenuation ratio, and impedance. This will help you make an informed decision based on your requirements. Taking the time to properly set up your oscilloscope will enable you to accurately analyze and debug communication protocols in your embedded systems.
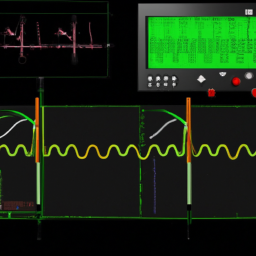
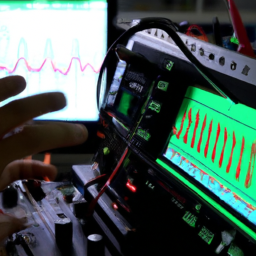
Capture and Analyze the Signals
To effectively capture and analyze signals in your embedded system, you need to utilize the triggering and timing features of your oscilloscope. These features allow you to set up specific conditions for capturing signals, such as triggering on a specific voltage level or edge.
Once you have captured the waveforms, you can analyze them to understand the behavior of your communication protocols and identify any issues or anomalies. Additionally, you can also analyze the data packets to ensure they’re being transmitted correctly and to troubleshoot any potential problems.
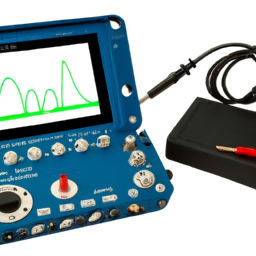
Use Triggering and Timing Features
Unlock the hidden secrets of your embedded system’s communication protocols by harnessing the power of an oscilloscope’s triggering and timing features.
With real-time analysis capabilities, you can accurately capture and analyze signals to identify and resolve latency issues in your communication protocols.
The triggering feature allows you to set specific conditions or events that will trigger the oscilloscope to capture the relevant signals, ensuring you capture the exact data you need for debugging.
By adjusting the trigger level, slope, and type, you can isolate and examine specific portions of the communication protocol waveform.
Additionally, the timing features provide precise measurements of signal intervals, allowing you to identify timing discrepancies and potential synchronization problems.
With the ability to trigger and analyze signals in real-time, you can effectively debug communication protocols in your embedded systems.
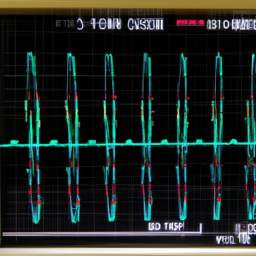
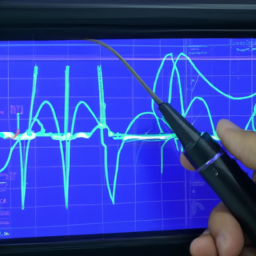
Analyze Waveforms and Data Packets
By harnessing the power of an oscilloscope’s analysis capabilities, you can dive deep into waveforms and data packets, identifying potential issues and ensuring optimal performance in your communication protocols. Analyzing waveforms and data packets allows you to uncover data corruption and identify error detection and correction techniques. An oscilloscope provides various tools to aid in this analysis, such as protocol decoding and triggering options. With protocol decoding, you can interpret the captured waveforms and extract meaningful information from the data packets. This helps in identifying any anomalies or errors present in the communication protocol. Additionally, triggering options allow you to focus on specific events or conditions within the waveform, making it easier to pinpoint potential issues. By utilizing these analysis capabilities, you can effectively debug and optimize your embedded system’s communication protocols.
| Analysis Tool | Function | ||
|---|---|---|---|
| Protocol decoding | Interpret captured waveforms and extract meaningful information from data packets | ||
| Triggering options | Focus on specific events or conditions within the waveform | ||
| Error detection and correction techniques | Identify and resolve data corruption and errors in the communication protocol | to ensure reliable data transmission and reception. |
Identify and Resolve Protocol Issues
To identify and resolve protocol issues in embedded systems, you need to first look for signal integrity problems. This involves analyzing the quality and stability of the signals being transmitted, ensuring they meet the required specifications.
Additionally, you should check for protocol violations, which can occur when the communication protocol is not followed correctly, leading to errors in data transmission.
By addressing these issues, you can ensure the reliable and efficient operation of the embedded system.
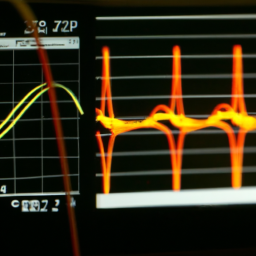
Look for Signal Integrity Problems
When hunting for signal integrity problems, it’s crucial to keep an eye out for even the tiniest glitches that could wreak havoc on your embedded system. Signal quality analysis is essential to identify and resolve any issues that may arise.
Start by examining the waveform on the oscilloscope, paying close attention to noise interference and any abnormalities. Look for any unexpected spikes, glitches, or distortions that could indicate a signal integrity problem. Use the oscilloscope’s measurement tools to quantify the noise level and check for any violations of the signal’s specifications.
Additionally, inspect the power supply and ground connections, as poor grounding can also lead to signal integrity issues.
By diligently looking for these potential problems, you can ensure the smooth operation of your communication protocols in embedded systems.
Check for Protocol Violations
Keep an eye out for any potential protocol violations that could disrupt the smooth operation of your embedded system. When debugging communication protocols with an oscilloscope, it’s crucial to detect anomalies and identify error patterns.
Protocol violations can occur due to various reasons such as incorrect data encoding, timing issues, or improper message sequencing. To check for protocol violations, analyze the captured waveform on the oscilloscope and compare it against the expected protocol behavior. Look for any deviations from the expected signal patterns, unexpected transitions, or missing data.
Additionally, pay attention to error codes, checksum failures, or other error indicators specified by the protocol. By carefully examining the waveform and comparing it with the protocol specifications, you can pinpoint any protocol violations that may exist and take the necessary steps to rectify them.
Use Advanced Features and Tools
To effectively debug communication protocols in embedded systems, you can utilize the advanced features and tools available. The Decode and Decode+ features allow you to view the decoded protocol data in a more organized and understandable manner, enabling you to quickly identify any issues or anomalies.
Additionally, using protocol analysis software further enhances your debugging capabilities by providing detailed analysis and insights into the protocol interactions. This makes it easier to pinpoint and resolve any communication problems.
Overall, by leveraging these advanced features and tools, you can effectively debug communication protocols in embedded systems.
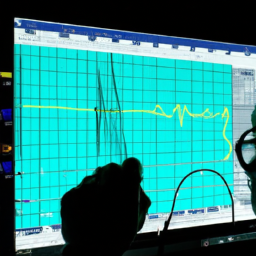
Decode and Decode+ Features
The Decode and Decode+ features of an oscilloscope allow engineers to analyze and interpret communication protocols in embedded systems, such as I2C or SPI. For example, by using the Decode+ feature, an engineer can quickly identify and troubleshoot issues in the communication between a microcontroller and a sensor in a smart home device.
-
Protocol Analysis: With the Decode feature, the oscilloscope can decode raw data into understandable packets, allowing engineers to analyze the protocol’s behavior and identify errors or anomalies.
-
Error Checking: The Decode feature can also perform error checking, highlighting CRC errors or other irregularities in the communication protocol.
-
Protocol Triggering: The oscilloscope’s Decode+ feature enables engineers to set up specific protocol triggers, capturing only the relevant data for analysis, reducing the amount of collected data and simplifying the debugging process.
-
Real-Time Display: The oscilloscope’s Decode+ feature provides a real-time display of decoded packets, allowing engineers to monitor the communication protocol’s behavior and make real-time adjustments if necessary.
By utilizing the Decode and Decode+ features, engineers can efficiently debug communication protocols in embedded systems, saving time and ensuring the reliability of the system.
Protocol Analysis Software
Imagine having software that can analyze and interpret the behavior of communication protocols, like I2C or SPI, in your embedded devices.
Protocol analysis software provides powerful tools for understanding and troubleshooting the communication between devices. With this software, you can capture and decode the signals on the bus, allowing you to visualize the protocol messages and their timing.
You can also use protocol analysis techniques to search for specific events or errors, enabling you to quickly identify and solve problems. The software often includes advanced features like triggering on specific protocol conditions or filtering out irrelevant data.
By utilizing protocol analysis software, you can efficiently debug communication protocols in embedded systems, saving time and effort in the troubleshooting process.
Troubleshooting Tips and Best Practices
Ensure you have a solid grounding connection when using an oscilloscope, as studies have shown that improper grounding can lead to inaccurate measurements. To effectively troubleshoot communication protocols in embedded systems, it’s important to follow some best practices and techniques. Here are five tips to help you in the process:
-
Use proper triggering: Set the oscilloscope to trigger on the relevant signal to capture the desired data accurately.
-
Analyze signal quality: Check for signal integrity issues such as noise, reflections, or crosstalk that can affect the communication protocol.
-
Verify timing and synchronization: Ensure that the timing and synchronization between different signals are correct, as timing issues are a common cause of communication failures.
-
Monitor data packets: Capture and analyze the data packets to identify any errors or anomalies that may be causing communication issues.
-
Check for protocol compliance: Validate if the communication protocol is being followed correctly by comparing the captured data with the protocol specifications.
By following these troubleshooting techniques and addressing common communication protocol issues, you can effectively debug and resolve problems in embedded systems using an oscilloscope.
Frequently Asked Questions
What are some common communication protocols used in embedded systems?
Common communication protocols used in embedded systems include I2C, SPI, UART, and CAN. These protocols enable devices to communicate and share data efficiently.
When troubleshooting communication protocol issues, it’s important to understand the specific protocol being used and its specifications. This involves checking the electrical connections, verifying the correct configuration settings, and analyzing the timing and waveform characteristics using tools like oscilloscopes.
By identifying and resolving protocol issues, the overall system functionality and performance can be improved.
How can I determine the baud rate of a serial communication protocol using an oscilloscope?
To determine the baud rate of a serial communication protocol using an oscilloscope, you can analyze the waveform of the transmitted data. Connect the oscilloscope’s probe to the serial communication line and set the trigger to the falling edge of the signal.
Measure the time between consecutive falling edges to calculate the bit duration. The baud rate can then be calculated by dividing the reciprocal of the bit duration by the number of bits per second.
Troubleshooting UART communication with an oscilloscope allows you to accurately determine the baud rate for effective debugging.
What are some common challenges in capturing and analyzing signals with an oscilloscope?
Common challenges in capturing and analyzing signals with an oscilloscope can include signal integrity issues and noise interference.
Signal integrity issues can arise from factors such as impedance mismatches, reflections, and crosstalk, which can distort the waveform and make it difficult to accurately analyze.
Noise interference can come from various sources, including electromagnetic interference (EMI) and power supply noise, which can affect the signal quality and make it challenging to identify and interpret the desired signal.
Are there any specific tools or techniques to identify and resolve protocol issues in embedded systems?
To identify and resolve protocol issues in embedded systems, there are several embedded systems debugging techniques you can employ.
One effective method is to analyze protocol timing with an oscilloscope. By carefully examining the timing of signals in the communication protocol, you can identify any timing discrepancies or errors that may be causing issues. The oscilloscope allows you to capture and analyze the signals in detail, helping you pinpoint and resolve protocol-related problems.
Can you provide some troubleshooting tips and best practices for debugging communication protocols with an oscilloscope?
To troubleshoot communication protocols with an oscilloscope, you can employ several techniques. First, ensure signal integrity by checking for noise or distortion. Use the oscilloscope to analyze the waveform and verify correct voltage levels, timing, and transitions.
Next, monitor the protocol-specific signals, such as data, clock, and control lines, to identify any irregularities. Additionally, triggering, decoding, and protocol analysis features in the oscilloscope can aid in pinpointing protocol issues and facilitating debugging.
Conclusion
In conclusion, mastering the art of debugging communication protocols in embedded systems with an oscilloscope is no small feat. It requires a deep understanding of the basics, meticulous setup procedures, and the ability to capture and analyze signals with precision.
By utilizing the advanced features and tools available, you can uncover and address protocol issues effectively. Remember to implement troubleshooting tips and best practices to navigate any challenges that may arise.
With determination and expertise, you can triumph over the complex world of communication protocols.