Have you ever experienced the frustration of dealing with bugs in your embedded systems? You spend hours trying to locate the source of the problem, only to be left scratching your head in confusion. But fear not, because there is a powerful tool that can help you overcome these obstacles: an oscilloscope.
In this beginner’s guide, we will walk you through the process of debugging embedded systems using an oscilloscope. By mastering this essential skill, you will be able to quickly identify and resolve common problems, saving you time and frustration.
We will start by explaining the basics of debugging and then show you how to set up your oscilloscope for effective troubleshooting. From there, we will delve into interpreting waveforms and using advanced techniques to pinpoint issues.
Throughout this guide, we will provide you with best practices to ensure efficient and effective debugging. So, let’s dive in and unlock the power of debugging with an oscilloscope!
Key Takeaways
- Understanding the basics of debugging embedded systems is essential for efficient troubleshooting.
- Utilizing an oscilloscope as a powerful tool during the debugging process can greatly assist in identifying and resolving common embedded system problems.
- Proper setup of the oscilloscope is crucial for effective debugging, including testing power supply, checking for loose connections, and using software debugging tools.
- Collaborating with team members and documenting the debugging sessions can contribute to continuous learning and improvement in debugging skills.
Understanding the Basics of Debugging Embedded Systems
If you’re new to debugging embedded systems, it’s crucial to understand the basics. Having a solid understanding of how these systems function is important when it comes to debugging techniques for real-time operating systems. Real-time operating systems have specific requirements for responsiveness and timing. Debugging them requires specialized techniques and tools.
In addition, debugging strategies for power consumption optimization are essential when working with embedded systems. Power optimization is a critical factor in many embedded applications. Debugging power-related issues requires a thorough understanding of the system’s power management features and the ability to analyze power consumption patterns.
By mastering these debugging basics, you’ll be well-equipped to tackle the challenges of debugging embedded systems and ensure optimal performance and efficiency.
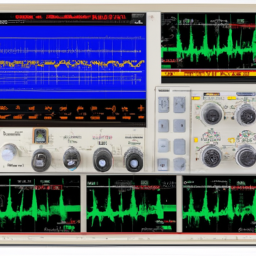
Setting Up Your Oscilloscope for Debugging
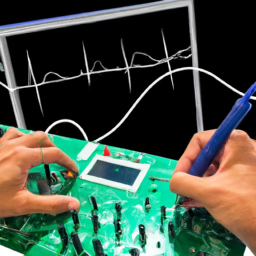
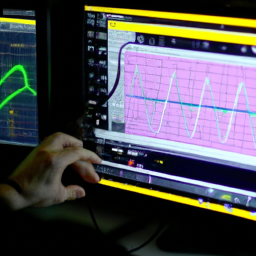
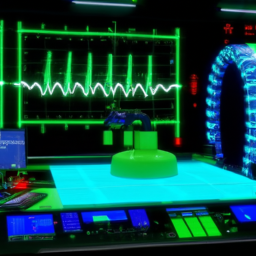
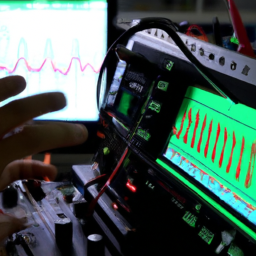
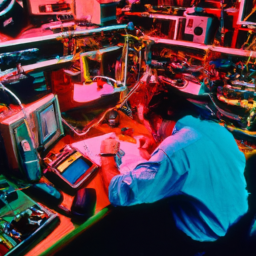
To get a clear picture of what’s happening in your electronic circuit, imagine an oscilloscope as the ‘eye’ that can see the invisible signals flowing through it.
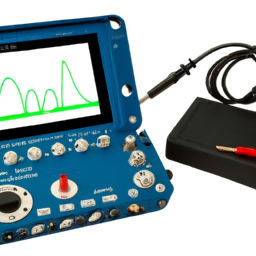
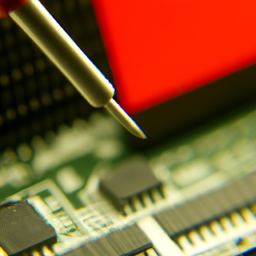
Setting up your oscilloscope correctly is crucial for effective debugging. First, ensure that the oscilloscope is properly connected to your embedded system. Use appropriate probes and cables, and make sure they’re securely attached.
Next, adjust the oscilloscope’s settings to match your debugging needs. Set the timebase and voltage scales to appropriate levels, and enable the necessary triggering options.
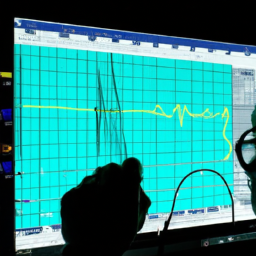
Troubleshooting hardware issues becomes easier with an oscilloscope, as you can visually observe and measure signals at different points in your circuit. Additionally, analyzing signal integrity problems, such as noise or distortion, is possible by examining waveforms on the oscilloscope display.
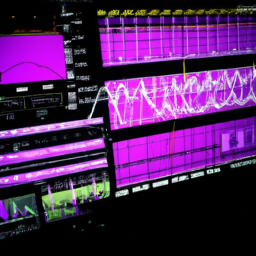
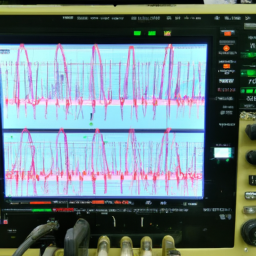
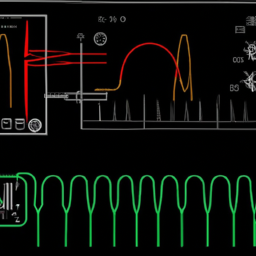
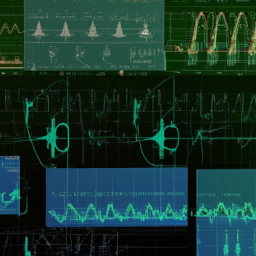
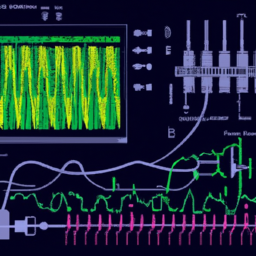
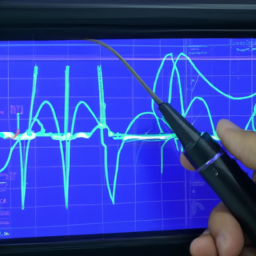
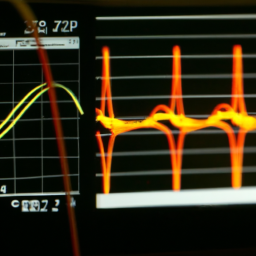
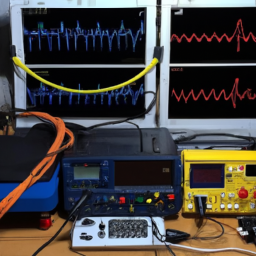
Interpreting Waveforms for Troubleshooting
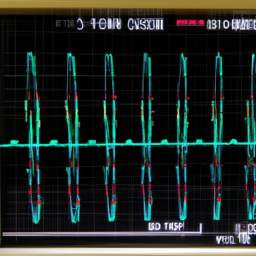
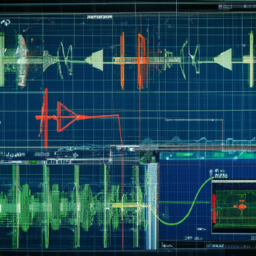
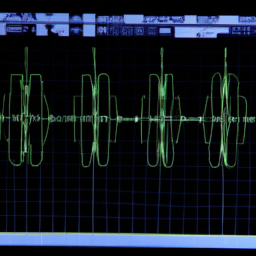
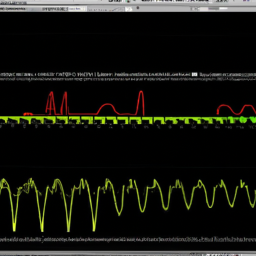
Understanding and interpreting waveforms on an oscilloscope display can be a fascinating and empowering experience, providing valuable insights for troubleshooting and resolving circuit issues. Analyzing signals using an oscilloscope involves evaluating various waveform characteristics, such as amplitude, frequency, and timing. By carefully observing these waveforms, you can identify anomalies or abnormalities that may indicate potential problems within the circuit. Troubleshooting techniques using an oscilloscope include comparing waveforms to expected patterns, looking for distortions or noise, and analyzing signal integrity. A useful approach is to use a 2 column and 4 row table to organize data and make comparisons. This can help you compare different waveforms, track changes over time, and identify potential areas of concern. Remember, mastering the art of interpreting waveforms is crucial for effective debugging of embedded systems.
Identifying and Resolving Common Embedded System Problems
Discover how you can confidently solve everyday issues in your embedded system with simple yet effective troubleshooting techniques. Here are three essential troubleshooting techniques to help you identify and resolve common problems in your embedded system:
-
Test your power supply: Ensure that your power supply is providing the correct voltage levels and is stable. Fluctuations or inadequate power can cause various issues in your system, including intermittent failures and erratic behavior.
-
Check for loose connections: Loose connections can lead to intermittent failures and unreliable operation. Make sure all the connectors and cables are securely attached and properly seated.
-
Use software debugging tools: In addition to using an oscilloscope, leverage software debugging tools like debuggers and emulators to identify and fix software-related issues. These tools allow you to step through code, set breakpoints, and analyze program flow, helping you pinpoint and resolve bugs efficiently.
By employing these troubleshooting techniques and being aware of common debugging pitfalls, you can confidently tackle problems in your embedded system and ensure its smooth operation.
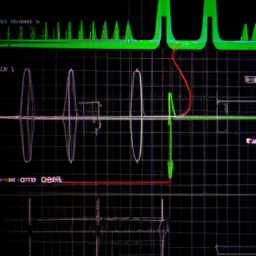
Advanced Debugging Techniques with an Oscilloscope
Unleash the full potential of your troubleshooting skills by mastering advanced techniques with an oscilloscope. This will help you uncover hidden issues and optimize your embedded system’s performance.
With advanced triggering techniques, you can capture specific events or anomalies in your system’s signals. This allows for more precise analysis and diagnosis of problems. Whether it’s a specific voltage level, a glitch, or a specific sequence of events, advanced triggering techniques enable you to pinpoint the exact moment of interest.
Additionally, analyzing power consumption is crucial for optimizing your embedded system’s performance. By using the oscilloscope’s current measurement capabilities, you can accurately measure the power consumed by different components of your system. This helps you identify power-hungry areas and implement power-saving measures.
The oscilloscope becomes an invaluable tool in your debugging arsenal, enabling you to tackle complex issues and improve the overall efficiency of your embedded system.
Best Practices for Efficient and Effective Debugging
When it comes to efficient and effective debugging, there are three key points to keep in mind.
Firstly, document and organize your debugging sessions to ensure that you can easily refer back to your findings and progress.
Secondly, collaborate with your team members to share insights and approaches, as multiple perspectives can lead to quicker resolutions.
Finally, continuously learn and improve your debugging skills by staying up-to-date with new techniques and tools in order to become a more effective debugger.
Documenting and Organizing Debugging Sessions
To effectively document and organize your debugging sessions, start by capturing detailed notes and creating a visual map of your troubleshooting process. This will allow you to navigate the complex web of information with ease and confidence.
By creating a visual map or flowchart of your debugging process, you can visualize the connections between different components and identify potential points of failure.
In your notes, be sure to include the date and time of each observation, as well as the specific actions you took and the results you obtained. This will help you identify patterns and potential causes of issues.
Don’t forget to share your findings with your team or colleagues. Documenting and organizing your debugging sessions will not only help you, but also the wider team to understand and troubleshoot the system more effectively.
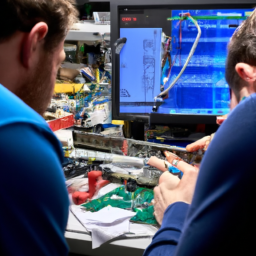
Collaborating with Team Members
Collaborating with your team members can be a fun and productive way to troubleshoot and overcome challenges together. When debugging embedded systems with an oscilloscope, brainstorming techniques can help generate fresh ideas and perspectives.
Encourage everyone to share their thoughts and suggestions openly, creating an environment where creativity can flourish. Remote collaboration strategies are also essential for effective teamwork, especially when team members are not physically present. Utilize online collaboration tools such as video conferences, screen sharing, and instant messaging to bridge the distance gap.
Regularly communicate and update each other on progress and findings. By leveraging the collective expertise of your team, you can tackle complex issues more efficiently, leading to faster and more successful debugging sessions.
Continuous Learning and Improvement in Debugging Skills
Don’t you just love how you think you know everything there is to know about debugging, only to realize there’s always room for improvement?
In the world of embedded systems, continuous learning and skill improvement are crucial for becoming a proficient debugger. As technology evolves, new challenges arise, and it’s essential to stay up-to-date with the latest debugging techniques and tools.
One way to achieve continuous learning is by actively seeking out resources such as books, online tutorials, and forums dedicated to embedded systems debugging. Additionally, engaging in hands-on practice with real-world projects and collaborating with experienced team members can greatly enhance your debugging skills.
Remember, the journey of becoming an expert debugger is never-ending. Embrace the opportunity to continuously learn and improve your skills in this ever-evolving field.
Frequently Asked Questions
How can I ensure the accuracy of my oscilloscope measurements?
To ensure the accuracy of your oscilloscope measurements, there are several factors to consider.
First, factors such as signal bandwidth, probe quality, and noise levels can impact measurement accuracy.
It is crucial to calibrate your oscilloscope regularly using techniques like self-calibration, external calibration, or waveform correction.
Additionally, verifying the probe compensation and using a high-quality ground connection can further enhance the precision of your measurements.
What are some common pitfalls to avoid when using an oscilloscope for debugging?
Common mistakes when using an oscilloscope for debugging include improper probe connections, incorrect voltage scaling, and inadequate grounding. To avoid these pitfalls, make sure the probe is properly connected and calibrated. Use the correct voltage scale setting and ensure a proper ground reference.
Additionally, employ troubleshooting techniques such as signal isolation, using multiple channels, and capturing screen images. These techniques can help effectively identify and resolve issues with embedded systems.
Can I use an oscilloscope to debug wireless communication issues in embedded systems?
Yes, you can use an oscilloscope to troubleshoot sensor failures in wireless communication and perform power analysis in embedded systems. An oscilloscope allows you to analyze the signal quality, detect noise or interference, and identify any power issues that may be affecting the wireless communication. By examining the waveform characteristics, you can pinpoint the source of the problem and take the necessary steps to resolve it.
Are there any specialized oscilloscope features or accessories that can aid in debugging specific types of embedded systems?
Specialized oscilloscope probes and real-time triggering capabilities can greatly enhance your ability to debug specific types of embedded systems. These probes are designed to handle high-speed digital signals, making them ideal for debugging communication issues.
Additionally, real-time triggering allows you to capture and analyze specific events or conditions in real-time, providing valuable insights into the behavior of your embedded system.
By utilizing these features and accessories, you can efficiently diagnose and resolve issues in your embedded system.
How can I troubleshoot intermittent issues in an embedded system using an oscilloscope?
To troubleshoot intermittent issues in an embedded system using oscilloscope techniques, start by setting the oscilloscope to trigger on the specific event causing the issue. Use the oscilloscope to capture and analyze the waveform, focusing on anomalies or unexpected behavior. Adjust the timebase and voltage scales as needed for detailed observation.
Additionally, utilize advanced features like waveform averaging or segmented memory to capture intermittent events.
By employing these oscilloscope techniques, you can effectively diagnose and resolve intermittent issues in embedded systems.
Conclusion
In conclusion, debugging embedded systems with an oscilloscope is a crucial skill for any engineer working in this field. By understanding the basics of debugging, setting up the oscilloscope correctly, and interpreting waveforms accurately, you can effectively identify and resolve common problems.
As an interesting statistic, studies have shown that using an oscilloscope can reduce debugging time by up to 80%, allowing for more efficient and effective troubleshooting. Adopting best practices and utilizing advanced techniques will further enhance your debugging capabilities.