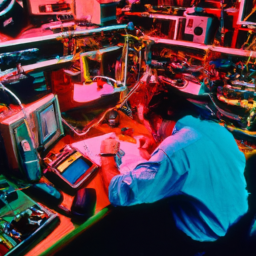
Imagine you’re a detective trying to crack a complex case. You have all the evidence, but you can’t make sense of it without the right tools. In the world of embedded systems, debugging can feel like solving a mystery. You have a problem, but you can’t solve it without the proper equipment.
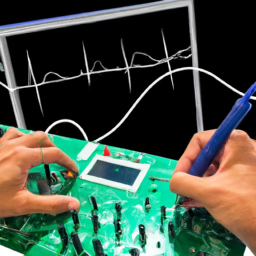
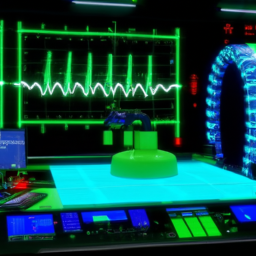
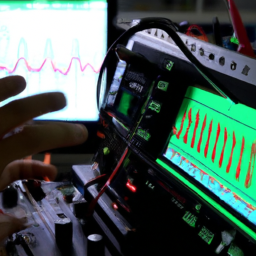
That’s where the oscilloscope comes in. An oscilloscope is like your trusty magnifying glass, helping you uncover the smallest details in your embedded system’s signals. It allows you to see what’s really happening under the surface, enabling you to identify and fix issues with precision.
In this article, we’ll explore five ways you can use an oscilloscope to debug embedded systems. From understanding the basics of debugging to utilizing advanced features, we’ll guide you through the process step by step.
So grab your detective hat and let’s dive into the world of embedded systems debugging with an oscilloscope!
Key Takeaways
- Proper setup and use of correct cables, probes, and grounding is crucial for accurate measurements.
- Impedance matching adapters or attenuators can be used to address connectivity issues.
- Protocol-specific probes provide accurate and efficient signal capture.
- Configuring oscilloscope settings, such as voltage scaling and trigger level, is important for stable signals and precise measurements.
Understand the Basics of Embedded Systems Debugging
Now, you can start your journey into the world of embedded systems debugging by understanding the basics and getting a grasp on how to use an oscilloscope.
Embedded systems troubleshooting can be challenging, as there are often multiple components interacting with each other. However, with the right knowledge and tools, such as an oscilloscope, you can effectively identify and resolve issues.
An oscilloscope is a powerful instrument that allows you to visualize and analyze electronic signals. It helps you to identify common debugging challenges, such as intermittent faults, timing issues, and signal integrity problems.
By learning how to interpret the waveforms displayed on the oscilloscope, you can gain valuable insights into the behavior of your embedded system and efficiently troubleshoot any issues that may arise.
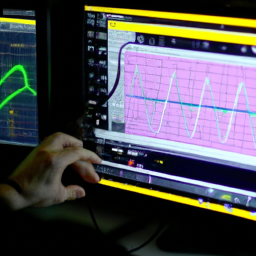
Set Up Your Oscilloscope Correctly
To properly set up your oscilloscope for debugging an embedded system, you need to connect the oscilloscope to the embedded system using the appropriate cables and probes. Ensure that the connections are secure and that the oscilloscope is properly grounded.
Once connected, configure the oscilloscope settings such as timebase, voltage scale, and triggering to accurately capture and measure the signals from the embedded system. Adjust the settings as needed to achieve the desired level of accuracy and resolution in your measurements.
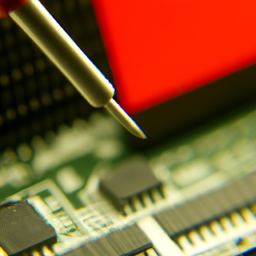
Connect the oscilloscope to the embedded system
Although it may seem challenging to connect the oscilloscope to the embedded system due to differing interfaces, there are various adapters available that can bridge the gap and ensure a seamless connection.
Troubleshooting common connectivity issues is crucial when connecting an oscilloscope to an embedded system. One common issue is the mismatch between the oscilloscope’s input impedance and the embedded system’s output impedance. This can lead to signal distortion and inaccurate measurements. To address this, you can use impedance matching adapters or attenuators.
Another alternative method for connecting an oscilloscope to an embedded system is using protocol-specific probes, such as I2C or SPI probes. These probes allow direct interfacing with the embedded system’s communication buses, providing a more accurate and efficient way to capture the signals.
By understanding these connectivity issues and exploring alternative methods, you can ensure a successful connection between the oscilloscope and the embedded system.
Configure the oscilloscope settings for accurate measurements
Don’t forget to fine-tune your oscilloscope’s settings to ensure precise measurements that will impress even the most skeptical engineers.
When debugging embedded systems, it’s crucial to understand the importance of signal stability in oscilloscope measurements. A stable signal ensures accurate and reliable data, allowing you to identify and troubleshoot issues effectively.
However, there are common pitfalls in oscilloscope configuration that you should be aware of. One such pitfall is improper voltage scaling, which can lead to distorted waveforms and incorrect measurements. Another common mistake is setting the oscilloscope’s trigger level too high or too low, resulting in missed events or excessive noise.
Additionally, overlooking the probe compensation can introduce inaccuracies in the measurements. By addressing these pitfalls and configuring your oscilloscope appropriately, you can achieve precise measurements and effectively debug embedded systems.
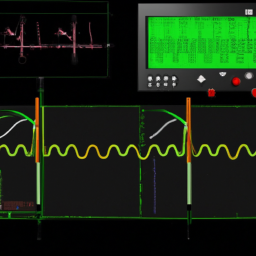
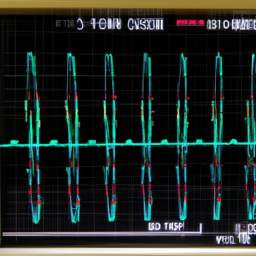
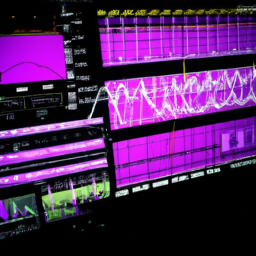
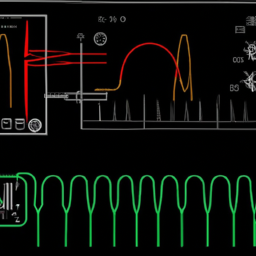
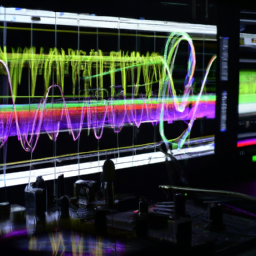
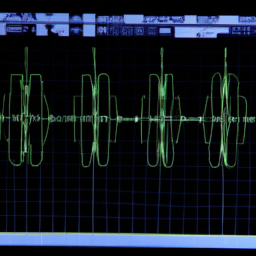
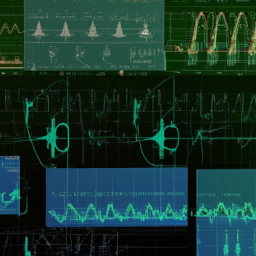
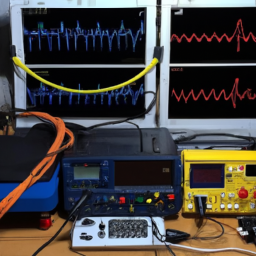
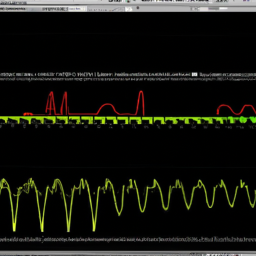
Use the Oscilloscope to Analyze Signals
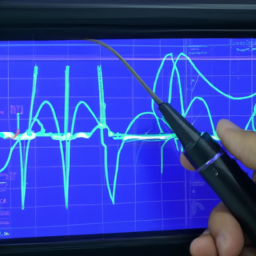
Using an oscilloscope is like having a detective’s magnifying glass to uncover the secrets hidden within the signals of an embedded system. To effectively analyze waveforms and identify signal anomalies, you need to understand how to interpret the data displayed on the oscilloscope screen.
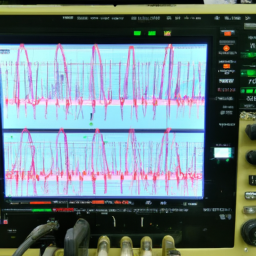
One way to analyze signals is by measuring the voltage and time parameters using the cursors feature. By placing cursors on specific points of interest, you can accurately measure signal characteristics such as frequency, amplitude, and rise time.
Another helpful tool is the math function of the oscilloscope, which allows you to perform mathematical operations on the waveform data. This can be particularly useful when trying to analyze complex waveforms or calculate signal parameters.
Additionally, the oscilloscope’s triggering capabilities can help you capture specific events or patterns in the signal. By setting the trigger level, slope, and mode correctly, you can ensure that the oscilloscope captures the desired waveform consistently.
Overall, using an oscilloscope to analyze signals is crucial for debugging embedded systems. It provides valuable insights into the behavior of the signals, helping you identify any anomalies and pinpoint the root causes of issues.
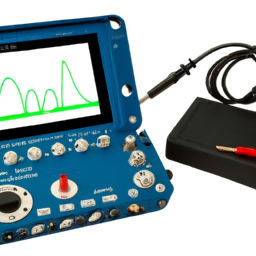
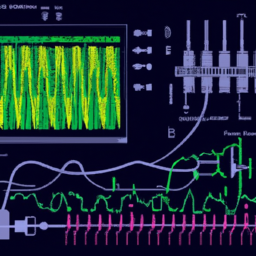
Utilize Advanced Oscilloscope Features
Make the most of the advanced features on your oscilloscope to uncover even more fascinating insights into signal behavior. When troubleshooting embedded systems, utilizing advanced oscilloscope techniques can greatly enhance your ability to diagnose and resolve issues.
One useful feature is the ability to perform math functions on acquired waveforms. This allows you to perform calculations such as FFT (Fast Fourier Transform) to analyze frequency content or differentiate and integrate waveforms to examine their rates of change.
Another valuable feature is the ability to set up trigger conditions based on specific events or patterns in the signal. This helps you capture and analyze specific occurrences that may be causing problems.
Additionally, advanced oscilloscopes often offer protocol decoding capabilities, allowing you to analyze digital signals and decode communication protocols such as I2C, SPI, or UART.
By leveraging these advanced features, you can gain deeper insights into signal behavior and effectively troubleshoot embedded systems.
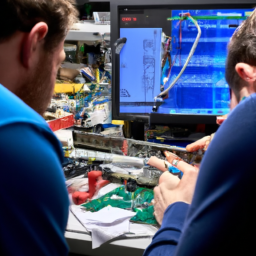
Troubleshoot Hardware and Software Issues
Explore the fascinating world of troubleshooting hardware and software issues to uncover the hidden secrets behind your system’s performance. When debugging an embedded system with an oscilloscope, it’s crucial to have a solid understanding of troubleshooting techniques to effectively identify and resolve common hardware and software issues.
Hardware problems can range from faulty connections to power supply issues. By using the oscilloscope’s advanced features, such as voltage measurements and signal analysis, you can pinpoint the root cause of hardware failures. This allows you to replace malfunctioning components or fix connectivity issues, ensuring your system operates flawlessly.
Software issues can be equally challenging to diagnose. By examining the digital signals and waveforms with the oscilloscope, you can identify software bugs, timing issues, or communication errors. This enables you to modify or optimize your code, improving the overall performance of your embedded system.
Troubleshooting hardware and software issues using an oscilloscope provides invaluable insight into the inner workings of your embedded system. Utilize the oscilloscope’s capabilities to effectively identify and resolve common issues, ensuring your system functions optimally.
Document and Evaluate Your Findings
When troubleshooting hardware and software issues in embedded systems, it’s crucial to keep detailed records of your debugging process.
This will enable you to track your progress, identify patterns, and refer back to previous findings if needed.
Additionally, it’s important to evaluate the effectiveness of your debugging techniques and make adjustments as needed.
By assessing the success or failure of different approaches, you can refine your methods and improve the overall efficiency of your debugging process.
Keep detailed records of your debugging process
One way to effectively debug embedded systems with an oscilloscope is by ensuring that you maintain detailed records of your debugging process. Keeping thorough documentation is crucial in maintaining a systematic approach to debugging. By documenting each step, observation, and analysis, you can easily track your progress and identify patterns or trends that may help in troubleshooting the issue. Additionally, detailed records allow for effective collaboration with other team members or future reference if a similar problem occurs. To help organize your records, consider using a table format to capture essential information such as date, time, observed behavior, measured signals, and any changes made during the debugging process. This structured approach will not only help you stay organized, but also improve the efficiency and accuracy of your embedded system debugging.
| Date | Time | Observed Behavior | Measured Signals | Changes Made |
|---|---|---|---|---|
| 01/01/22 | 10:00 | System not responding | No signal on Pin 5 | Checked power supply voltage |
| 01/01/22 | 10:15 | System rebooted | Signal on Pin 5 | Replaced faulty component |
| 01/01/22 | 10:30 | System stable | Signal within limits | None |
| 01/01/22 | 10:45 | System crashed | No signal on Pin 5 | Checked for loose connections |
| 01/01/22 | 11:00 | System restarted | Signal on Pin 5 | Adjusted signal levels |
Evaluate the effectiveness of your debugging techniques and make adjustments as needed
To ensure a successful debugging process, it’s crucial to evaluate the effectiveness of your techniques and make necessary adjustments. Here are four key steps to help you evaluate and improve your debugging techniques:
-
Analyze the data: Carefully examine the data collected during the debugging process. Look for patterns, anomalies, or correlations that may provide valuable insights into the root cause of the issue.
-
Identify bottlenecks: Identify any bottlenecks or areas where your debugging techniques may be falling short. This could include inefficient use of resources, lack of understanding of the system, or incorrect assumptions.
-
Seek feedback: Collaborate with colleagues or experts in the field to gain fresh perspectives and insights. Their feedback can help identify blind spots and suggest alternative approaches.
-
Implement changes: Based on the evaluation and feedback, implement necessary changes to your debugging techniques. This may involve adopting new tools, modifying existing procedures, or acquiring additional knowledge.
By continually evaluating the efficiency of your debugging techniques and implementing necessary changes, you can enhance your ability to diagnose and resolve issues in embedded systems effectively.
Frequently Asked Questions
What are some common challenges faced when debugging embedded systems using an oscilloscope?
Common challenges when debugging embedded systems using an oscilloscope include signal integrity issues and limited memory depth. Troubleshooting techniques involve ensuring proper grounding and shielding to minimize noise interference, optimizing probe connections, and using advanced triggering features like edge triggering and pulse width triggering.
Additionally, understanding the system’s architecture and having knowledge of the specific microcontroller or processor being used can help in identifying and resolving issues efficiently.
How can I determine the appropriate settings and configurations for my oscilloscope when debugging embedded systems?
To determine the appropriate settings and configurations for your oscilloscope when debugging embedded systems, you must consider a few key factors.
Start by identifying the specific signals you need to analyze and their characteristics, such as amplitude and frequency.
Next, set the appropriate voltage range, timebase, and trigger settings to accurately capture the desired signal.
Configure the oscilloscope for debugging by adjusting probe attenuation, channel coupling, and triggering mode according to your system’s requirements.
Are there any limitations or drawbacks to using an oscilloscope for analyzing signals in embedded systems?
When analyzing signals in embedded systems using an oscilloscope, there are a few limitations and drawbacks to consider. Firstly, the oscilloscope’s bandwidth can restrict the range of frequencies that can be accurately measured.
Additionally, the sampling rate may limit the resolution and ability to capture fast-changing signals.
Furthermore, the oscilloscope’s memory depth can restrict the duration of signals that can be captured and analyzed.
Lastly, the cost of high-quality oscilloscopes may pose a financial limitation for some users.
What are some advanced features of an oscilloscope that can be particularly useful for debugging embedded systems?
Unlock the full potential of your oscilloscope to debug embedded systems with advanced triggering and waveform decoding. These cutting-edge features allow you to precisely capture and analyze complex signals, uncovering hidden issues within your system.
Advanced triggering capabilities enable you to set specific conditions for signal capture, ensuring you capture the right data at the right time.
Waveform decoding simplifies the analysis process by translating complex signal patterns into easily understandable data, saving you time and effort.
How can I effectively troubleshoot and differentiate between hardware and software issues when using an oscilloscope for debugging embedded systems?
To effectively troubleshoot and differentiate between hardware and software issues when using an oscilloscope for debugging embedded systems, there are a few troubleshooting tips you can follow.
Firstly, carefully analyze the waveform patterns to identify any abnormalities or inconsistencies, as they can indicate hardware faults.
Additionally, you can use the oscilloscope to monitor different signals simultaneously, allowing you to compare and contrast their behavior, aiding in isolating the issue.
Lastly, by using the oscilloscope’s triggering capabilities, you can capture specific events and analyze them in detail, helping to identify software-related problems.
Conclusion
So there you have it, five ways to effectively debug embedded systems using an oscilloscope. By understanding the basics of embedded systems debugging and setting up your oscilloscope correctly, you can then use it to analyze signals and utilize advanced features for troubleshooting hardware and software issues.
Documenting and evaluating your findings will help you track progress and make informed decisions. Remember, debugging is like being a detective, carefully examining the evidence and following the clues to solve the mystery of the malfunctioning system.
Happy debugging!