Did you know that embedded systems are becoming increasingly complex, with more functionality and higher performance requirements? In fact, according to a recent study, the market for embedded systems is expected to reach $214 billion by 2025.
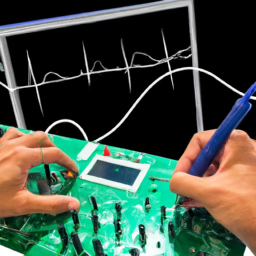
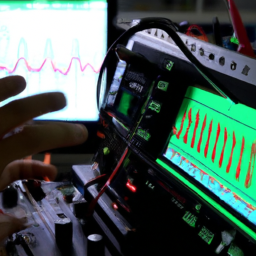
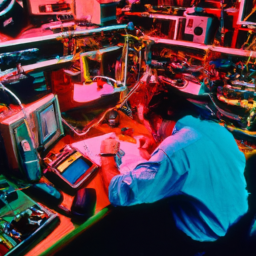
With such advancements, debugging these systems can be a daunting task. However, fear not! With the right tools and techniques, you can efficiently debug embedded systems and save valuable time and resources. One such tool is an oscilloscope, which allows you to visualize and analyze electronic signals.
In this article, we will provide you with 10 tips for effectively debugging embedded systems with an oscilloscope. From understanding the basics of your oscilloscope to utilizing advanced features for deep analysis, these tips will help you identify and resolve issues quickly.
So, let’s dive in and master the art of debugging embedded systems with an oscilloscope!
Key Takeaways
- Understand the basics of your oscilloscope for troubleshooting.
- Use triggering techniques like edge triggering, pulse width triggering, slope triggering, and pattern triggering for enhanced debugging efficiency.
- Analyze signal waveforms for potential issues such as irregularities, glitches, noise, distortions, and sudden changes in amplitude, frequency, and timing.
- Utilize advanced features of an oscilloscope for deep analysis, such as advanced triggering methods, waveform math, FFT analysis, and mask testing.
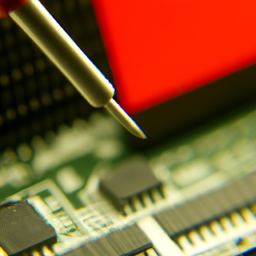
Understand the Basics of Your Oscilloscope
You’ll be amazed at how much easier troubleshooting becomes when you fully understand the basics of your oscilloscope.
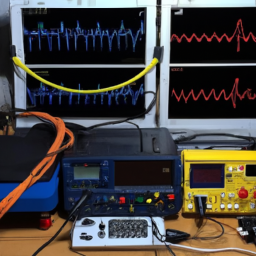
To begin troubleshooting common oscilloscope errors, it’s crucial to familiarize yourself with the various controls and functions of your device. Start by setting up proper voltage and time scales for accurate measurements.
Adjust the vertical controls to ensure the waveform is visible and properly scaled. Use the horizontal controls to adjust the time base and observe the waveform’s time duration.
Additionally, pay attention to the trigger controls, as they allow you to stabilize the waveform and capture specific events.
Understanding these fundamental aspects of your oscilloscope will greatly enhance your ability to accurately diagnose and debug embedded systems.
Use Triggering Techniques for Efficient Debugging
To maximize efficiency when debugging embedded systems with an oscilloscope, it’s important to employ triggering techniques. These techniques help ensure reliable measurements and assist in troubleshooting common triggering issues.
Here are four important triggering techniques to consider:
-
Edge Triggering: Set the oscilloscope to trigger on a specific edge of a signal, such as rising or falling.
-
Pulse Width Triggering: Trigger the oscilloscope based on the duration of a pulse, allowing you to capture specific events.
-
Slope Triggering: Trigger the oscilloscope based on the slope of a signal, such as positive or negative, to capture specific waveform characteristics.
-
Pattern Triggering: Trigger the oscilloscope based on specific patterns in the signal, helping to capture complex events.
By utilizing these triggering techniques, you can efficiently debug embedded systems and quickly identify and resolve any issues that may arise.
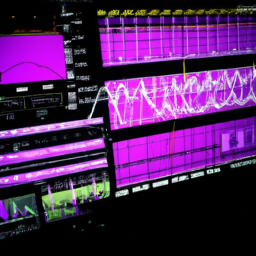
Analyze Signal Waveforms for Abnormalities
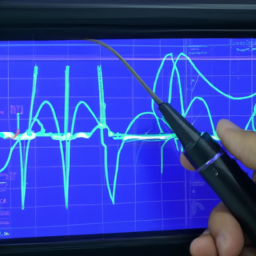
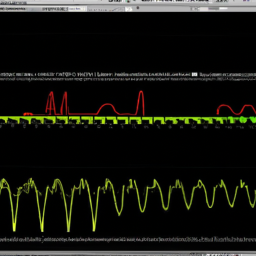
Examine the signal waveforms for any irregularities or abnormalities, as they can provide valuable insights into potential issues that may be affecting your troubleshooting process. By utilizing common troubleshooting techniques, you can effectively analyze the measurement data obtained from your oscilloscope.
Start by identifying any unexpected variations in the waveform, such as glitches, noise, or distortions. Pay close attention to the amplitude, frequency, and timing of the signals to ensure they align with the expected behavior. Look for any sudden changes or inconsistencies that could indicate faulty components or improper circuit operation.
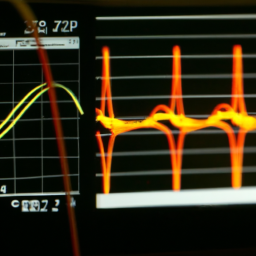
Additionally, compare the measured waveforms to reference waveforms or datasheets to determine if they match the expected characteristics. Interpreting measurement data accurately is crucial for identifying and resolving problems efficiently, so meticulous analysis of signal waveforms is essential.
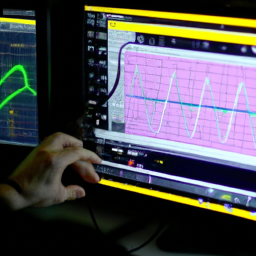
Use Probing Techniques for Accurate Measurements
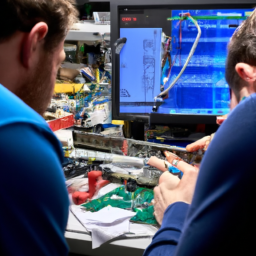
Enhance your troubleshooting skills by mastering the art of accurate measurements through effective probing techniques. When debugging embedded systems with an oscilloscope, it’s crucial to use proper probing techniques to ensure accurate results.
One important aspect to consider is compensation techniques for accurate probing. By adjusting the compensation trimmer on the oscilloscope probe, you can minimize signal distortion and obtain precise measurements.
It’s also important to be aware of common pitfalls in using oscilloscope probes. These include using long ground leads, which can introduce noise and affect the measurement accuracy, and using inappropriate probe tips, which may lead to improper signal acquisition.
By avoiding these pitfalls and employing compensation techniques, you can ensure accurate measurements and effectively debug your embedded systems.
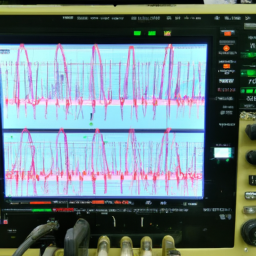
Utilize Advanced Features for Deep Analysis
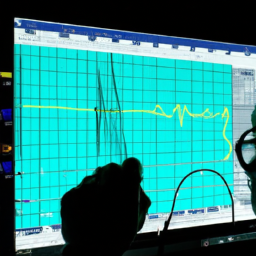
Make the most of advanced features to dive deep into analysis and discover hidden insights that will leave you amazed. When debugging embedded systems with an oscilloscope, it’s crucial to utilize advanced triggering methods. These methods allow you to set up triggers based on specific signal conditions, such as edge triggers, pulse width triggers, or even triggers based on serial bus content. By using these advanced triggering methods, you can focus on the specific events or conditions that are causing issues in your embedded system, saving you time and effort.
Additionally, interpreting complex signals is made easier with the oscilloscope’s advanced features. These features include waveform math, FFT analysis, and mask testing. With waveform math, you can perform complex mathematical operations on acquired waveforms. FFT analysis helps you analyze frequency content, while mask testing allows you to compare signals against predefined masks for compliance testing. By leveraging these advanced features, you can gain a deeper understanding of your embedded system’s behavior and effectively troubleshoot any issues that may arise.
Document and Organize Your Debugging Process
Take a moment to reflect on the satisfaction you’ll feel when you efficiently document and organize your debugging process, allowing for a smooth and systematic approach to troubleshooting. By implementing proper documentation and organization techniques, you can significantly improve efficiency and troubleshoot hardware issues more effectively.
Here are three sub-lists that will help you achieve this:
-
Create a detailed log: Maintain a logbook to record your observations, steps taken, and results obtained during the debugging process. This will serve as a reference for future troubleshooting and enable you to track your progress effectively.
-
Use labeling and tagging: Clearly label and tag your oscilloscope waveforms, screenshots, and measurements. This will make it easier to find and reference specific data later on, saving you valuable time during analysis.
-
Organize your data: Establish a logical folder structure on your computer to store oscilloscope data, firmware files, schematics, and any other relevant documents. Categorize and name your files appropriately, ensuring easy access and retrieval when needed.
By following these practices, you can streamline your debugging process, increase your productivity, and ultimately resolve hardware issues more efficiently.
Frequently Asked Questions
How can I determine the appropriate voltage range for my oscilloscope when debugging an embedded system?
To determine the appropriate voltage range for your oscilloscope when debugging an embedded system, you need to consider the voltage levels present in your system. Start by understanding the voltage requirements of your system’s components and signals.
Measure the highest and lowest voltage levels you expect to encounter. Choose an oscilloscope with an input voltage range that encompasses these levels. Ensure the oscilloscope’s accuracy is within your desired range for accurate measurements.
What are some common sources of noise in embedded systems and how can I identify and eliminate them using an oscilloscope?
When troubleshooting noise issues in embedded systems, it’s crucial to identify common sources of noise. Using an oscilloscope, you can pinpoint noise sources such as ground loops, electromagnetic interference, and power supply fluctuations. By carefully analyzing the waveform and frequency spectrum, you can accurately locate the noise. Then, you can take appropriate measures to eliminate it. This precise and technical approach will help you achieve a noise-free embedded system.
Can an oscilloscope help me identify and troubleshoot issues related to power supply or ground connections in my embedded system?
Yes, an oscilloscope can be a valuable tool for identifying and troubleshooting issues related to power supply and ground connections in your embedded system. By connecting the oscilloscope probes to the power supply and ground points, you can measure the voltage levels and check for any fluctuations or abnormalities. This can help you identify if there are any issues with the power supply or if there are problems with the ground connections that may be causing noise or interference in your system.
Are there any specific oscilloscope features or settings that can help me analyze the behavior of digital signals in my embedded system?
To analyze the behavior of digital signals in your embedded system, you can utilize specific oscilloscope features and settings. Using oscilloscope triggers allows you to capture specific digital signal events, such as edge transitions or data patterns, which can aid in identifying and troubleshooting issues.
Additionally, an oscilloscope can help in analyzing signal integrity issues by examining signal distortions, noise, and timing violations. These capabilities enable you to precisely diagnose and rectify problems in your embedded system.
How can I use an oscilloscope to verify the timing and synchronization of different signals in my embedded system?
To verify the timing and synchronization of signals in your embedded system, you can use an oscilloscope. Start by connecting the probe to the desired signal. Set the timebase to capture the complete waveform and adjust the voltage scale for optimal visibility.
Next, use the cursors to measure the time between rising or falling edges of different signals. This will help you determine if the signals are properly synchronized. If you encounter any communication issues, you can troubleshoot them by comparing the timing and synchronization of signals in different parts of the system.
By doing this, you can identify and resolve any discrepancies in signal integrity.
Conclusion
In conclusion, you’ve now mastered the art of debugging embedded systems with an oscilloscope. By understanding the basics, utilizing triggering techniques, analyzing signal waveforms, and using probing techniques, you’ve become an expert in efficient and accurate measurements.
Furthermore, by utilizing the advanced features and documenting your debugging process, you’ve achieved deep analysis and organization. With these tips, you’ll be able to tackle any debugging challenge with confidence and precision.
So go forth and conquer the complexity of embedded systems with your newfound oscilloscope skills!